
Search for Indicators
Health
Indicator Gauge Icon Legend
Legend Colors
Red is bad, green is good, blue is not statistically different/neutral.
Compared to Distribution
 the value is in the best half of communities.
 the value is in the 2nd worst quarter of communities.
 the value is in the worst quarter of communities.
Compared to Target
 meets target;
  does not meet target.
Compared to a Single Value
 lower than the comparison value;
 higher than the comparison value;
 not statistically different from comparison value.
Trend

 non-significant change over time;
 significant change over time;
  no change over time.
Compared to Prior Value
 higher than the previous measurement period;
 lower than the previous measurement period;
 no statistically different change from previous measurement period.
Health / Adolescent Health
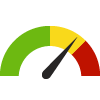
7th Grade Students who are Physically Fit County: Kings
7th Grade Students who are Physically Fit County: Kings
51.6%
(2018-2019)
Compared to:


CA Counties
The distribution is based on data from 58 California counties.
CA Value
(61.0%)
The regional value is compared to the California state value.
Prior Value
(47.9%)
Prior Value compares a measured value with the previously measured value. Confidence intervals were not taken into account in determining the direction of the comparison.
Trend
This comparison measures the indicator’s values over multiple time periods.<br>The Mann-Kendall Test for Statistical Significance is used to evaluate the trend<br>over 4 to 10 periods of measure, subject to data availability and comparability.
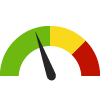
Teens who have Used Alcohol County: Kings
Teens who have Used Alcohol County: Kings
40.5%
(2021-2022)
Compared to:


CA Counties
(2011-2012)
The distribution is based on data from 44 California counties and county groups.
CA Value
(23.1% in 2019-2021)
The regional value is compared to the California state value.
Prior Value
(30.8%)
Prior Value compares a measured value with the previously measured value. Confidence intervals were taken into account in determining the direction of the comparison.
Trend
This comparison measures the indicator’s values over multiple time periods.<br>The Mann-Kendall Test for Statistical Significance is used to evaluate the trend<br>over 4 to 10 periods of measure, subject to data availability and comparability.
Teens who Smoke: 11th Graders County: Kings
Teens who Smoke: 11th Graders County: Kings
3.0%
(2017-2019)
Compared to:
CA Value
(2.0%)
The regional value is compared to the California state value.
Prior Value
(8.0%)
Prior Value compares a measured value with the previously measured value. Confidence intervals were not taken into account in determining the direction of the comparison.
Teens who Smoke: 7th Graders County: Kings
Teens who Smoke: 7th Graders County: Kings
0.0%
(2017-2019)
Compared to:
CA Value
(1.0%)
The regional value is compared to the California state value.
Prior Value
(1.0%)
Prior Value compares a measured value with the previously measured value. Confidence intervals were not taken into account in determining the direction of the comparison.
Teens who Smoke: 9th Graders County: Kings
Teens who Smoke: 9th Graders County: Kings
2.0%
(2017-2019)
Compared to:
CA Value
(2.0%)
The regional value is compared to the California state value.
Prior Value
(4.0%)
Prior Value compares a measured value with the previously measured value. Confidence intervals were not taken into account in determining the direction of the comparison.
Health / Cancer
Adults with Cancer County: Kings
Adults with Cancer County: Kings
4.9%
(2021)
Compared to:
CA Counties
The distribution is based on data from 58 California counties.
U.S. Counties
The distribution is based on data from 3,074 U.S. counties and county equivalents.
US Value
(7.0%)
The regional value is compared to the national value.
Age-Adjusted Death Rate due to Breast Cancer County: Kings
Age-Adjusted Death Rate due to Breast Cancer County: Kings
14.5
Deaths per 100,000 females
(2016-2020)
Compared to:
CA Counties
The distribution is based on data from 49 California counties.
U.S. Counties
The distribution is based on data from 1,755 U.S. counties and county equivalents.
CA Value
(18.8)
The regional value is compared to the California state value.
US Value
(19.6)
The regional value is compared to the national value.
Prior Value
(16.5)
Prior Value compares a measured value with the previously measured value. Confidence intervals were taken into account in determining the direction of the comparison.
Trend
This comparison measures the indicator’s values over multiple time periods.<br>The Mann-Kendall Test for Statistical Significance is used to evaluate the trend<br>over 4 to 10 periods of measure, subject to data availability and comparability.
HP 2030 Target
(15.3)
Age-Adjusted Death Rate due to Cancer County: Kings
Age-Adjusted Death Rate due to Cancer County: Kings
136.6
Deaths per 100,000 population
(2019-2021)
Compared to:
CA Counties
The distribution is based on data from 58 California counties.
CA Value
(124.9)
The regional value is compared to the California state value.
US Value
(155.9 in 2016)
The regional value is compared to the national value. The source for the national value is National Cancer Institute
Prior Value
(145.1)
Prior Value compares a measured value with the previously measured value. Confidence intervals were taken into account in determining the direction of the comparison.
Trend
This comparison measures the indicator’s values over multiple time periods.<br>The Mann-Kendall Test for Statistical Significance is used to evaluate the trend<br>over 4 to 10 periods of measure, subject to data availability and comparability.
HP 2030 Target
(122.7)
Age-Adjusted Death Rate due to Colorectal Cancer County: Kings
Age-Adjusted Death Rate due to Colorectal Cancer County: Kings
11.9
Deaths per 100,000 population
(2016-2020)
Compared to:


CA Counties
The distribution is based on data from 52 California counties.
U.S. Counties
The distribution is based on data from 2,174 U.S. counties and county equivalents.
CA Value
(12.1)
The regional value is compared to the California state value.
US Value
(13.1)
The regional value is compared to the national value.
Prior Value
(12.9)
Prior Value compares a measured value with the previously measured value. Confidence intervals were taken into account in determining the direction of the comparison.
Trend
This comparison measures the indicator’s values over multiple time periods.<br>The Mann-Kendall Test for Statistical Significance is used to evaluate the trend<br>over 4 to 10 periods of measure, subject to data availability and comparability.
HP 2030 Target
(8.9)
Age-Adjusted Death Rate due to Lung Cancer County: Kings
Age-Adjusted Death Rate due to Lung Cancer County: Kings
26.6
Deaths per 100,000 population
(2019-2021)
Compared to:
CA Counties
The distribution is based on data from 58 California counties.
CA Value
(21.6)
The regional value is compared to the California state value.
US Value
(38.5 in 2016)
The regional value is compared to the national value. The source for the national value is National Cancer Institute
Prior Value
(26.5)
Prior Value compares a measured value with the previously measured value. Confidence intervals were taken into account in determining the direction of the comparison.
Trend
This comparison measures the indicator’s values over multiple time periods.<br>The Mann-Kendall Test for Statistical Significance is used to evaluate the trend<br>over 4 to 10 periods of measure, subject to data availability and comparability.
HP 2030 Target
(25.1)
Age-Adjusted Death Rate due to Prostate Cancer County: Kings
Age-Adjusted Death Rate due to Prostate Cancer County: Kings
15.0
Deaths per 100,000 males
(2016-2020)
Compared to:
U.S. Counties
The distribution is based on data from 1,576 U.S. counties and county equivalents.
CA Value
(19.8)
The regional value is compared to the California state value.
US Value
(18.8)
The regional value is compared to the national value.
Prior Value
(19.1)
Prior Value compares a measured value with the previously measured value. Confidence intervals were taken into account in determining the direction of the comparison.
Trend
This comparison measures the indicator’s values over multiple time periods.<br>The Mann-Kendall Test for Statistical Significance is used to evaluate the trend<br>over 4 to 10 periods of measure, subject to data availability and comparability.
HP 2030 Target
(16.9)
Breast Cancer Incidence Rate County: Kings
Breast Cancer Incidence Rate County: Kings
95.4
Cases per 100,000 females
(2016-2020)
Compared to:
CA Counties
The distribution is based on data from 56 California counties.
U.S. Counties
The distribution is based on data from 2,478 U.S. counties and county equivalents.
CA Value
(121.0)
The regional value is compared to the California state value.
US Value
(127.0)
The regional value is compared to the national value.
Prior Value
(101.2)
Prior Value compares a measured value with the previously measured value. Confidence intervals were taken into account in determining the direction of the comparison.
Trend
This comparison measures the indicator’s values over multiple time periods.<br>The Mann-Kendall Test for Statistical Significance is used to evaluate the trend<br>over 4 to 10 periods of measure, subject to data availability and comparability.
Cancer: Medicare Population County: Kings
Cancer: Medicare Population County: Kings
9.0%
(2022)
Compared to:
CA Counties
The distribution is based on data from 58 California counties.
U.S. Counties
The distribution is based on data from 3,129 U.S. counties and county equivalents.
CA Value
(11.0%)
The regional value is compared to the California state value.
US Value
(12.0%)
The regional value is compared to the national value.
Prior Value
(9.0%)
Prior Value compares a measured value with the previously measured value. Confidence intervals were not taken into account in determining the direction of the comparison.
Trend
This comparison measures the indicator’s values over multiple time periods.<br>The Mann-Kendall Test for Statistical Significance is used to evaluate the trend<br>over 4 to 10 periods of measure, subject to data availability and comparability.
Cervical Cancer Incidence Rate County: Kings
Cervical Cancer Incidence Rate County: Kings
8.7
Cases per 100,000 females
(2016-2020)
Compared to:
CA Counties
The distribution is based on data from 40 California counties.
U.S. Counties
The distribution is based on data from 696 U.S. counties and county equivalents.
CA Value
(7.3)
The regional value is compared to the California state value.
US Value
(7.5)
The regional value is compared to the national value.
Prior Value
(10.0)
Prior Value compares a measured value with the previously measured value. Confidence intervals were taken into account in determining the direction of the comparison.
Trend
This comparison measures the indicator’s values over multiple time periods.<br>The Mann-Kendall Test for Statistical Significance is used to evaluate the trend<br>over 4 to 10 periods of measure, subject to data availability and comparability.
Cervical Cancer Screening: 21-65 County: Kings
Cervical Cancer Screening: 21-65 County: Kings
79.9%
(2020)
Compared to:
CA Counties
The distribution is based on data from 58 California counties.
U.S. Counties
The distribution is based on data from 3,141 U.S. counties and county equivalents.
US Value
(82.8%)
The regional value is compared to the national value.
Colon Cancer Screening: USPSTF Recommendation County: Kings
Colon Cancer Screening: USPSTF Recommendation County: Kings
56.2%
(2020)
Compared to:
CA Counties
The distribution is based on data from 58 California counties.
U.S. Counties
The distribution is based on data from 3,141 U.S. counties and county equivalents.
US Value
(72.4%)
The regional value is compared to the national value.
Colorectal Cancer Incidence Rate County: Kings
Colorectal Cancer Incidence Rate County: Kings
26.8
Cases per 100,000 population
(2016-2020)
Compared to:
CA Counties
The distribution is based on data from 56 California counties.
U.S. Counties
The distribution is based on data from 2,401 U.S. counties and county equivalents.
CA Value
(33.5)
The regional value is compared to the California state value.
US Value
(36.5)
The regional value is compared to the national value.
Prior Value
(29.2)
Prior Value compares a measured value with the previously measured value. Confidence intervals were taken into account in determining the direction of the comparison.
Trend
This comparison measures the indicator’s values over multiple time periods.<br>The Mann-Kendall Test for Statistical Significance is used to evaluate the trend<br>over 4 to 10 periods of measure, subject to data availability and comparability.
Households that Received Cancer Medical Services County: Kings
Households that Received Cancer Medical Services County: Kings
7.4%
(2023)
Compared to:


CA Value
(7.9%)
The regional value is compared to the California state value.
US Value
(8.3%)
The regional value is compared to the national value.
Prior Value
(7.6%)
Prior Value compares a measured value with the previously measured value. Confidence intervals were not taken into account in determining the direction of the comparison.
Trend
This comparison measures the indicator’s values over multiple time periods.<br>The Mann-Kendall Test for Statistical Significance is used to evaluate the trend<br>over 4 to 10 periods of measure, subject to data availability and comparability.
Lung and Bronchus Cancer Incidence Rate County: Kings
Lung and Bronchus Cancer Incidence Rate County: Kings
37.1
Cases per 100,000 population
(2016-2020)
Compared to:
CA Counties
The distribution is based on data from 55 California counties.
U.S. Counties
The distribution is based on data from 2,471 U.S. counties and county equivalents.
CA Value
(37.6)
The regional value is compared to the California state value.
US Value
(54.0)
The regional value is compared to the national value.
Prior Value
(40.2)
Prior Value compares a measured value with the previously measured value. Confidence intervals were taken into account in determining the direction of the comparison.
Trend
This comparison measures the indicator’s values over multiple time periods.<br>The Mann-Kendall Test for Statistical Significance is used to evaluate the trend<br>over 4 to 10 periods of measure, subject to data availability and comparability.
Mammogram in Past 2 Years: 50-74 County: Kings
Mammogram in Past 2 Years: 50-74 County: Kings
66.4%
(2020)
Compared to:
CA Counties
The distribution is based on data from 58 California counties.
U.S. Counties
The distribution is based on data from 3,141 U.S. counties and county equivalents.
US Value
(78.2%)
The regional value is compared to the national value.
HP 2030 Target
(80.3%)
Mammography Screening: Medicare Population County: Kings
Mammography Screening: Medicare Population County: Kings
36.0%
(2022)
Compared to:
CA Counties
The distribution is based on data from 58 California counties.
U.S. Counties
The distribution is based on data from 3,123 U.S. counties and county equivalents.
CA Value
(41.0%)
The regional value is compared to the California state value.
US Value
(47.0%)
The regional value is compared to the national value.
Prior Value
(36.0%)
Prior Value compares a measured value with the previously measured value. Confidence intervals were not taken into account in determining the direction of the comparison.
Trend
This comparison measures the indicator’s values over multiple time periods.<br>The Mann-Kendall Test for Statistical Significance is used to evaluate the trend<br>over 4 to 10 periods of measure, subject to data availability and comparability.
Oral Cavity and Pharynx Cancer Incidence Rate County: Kings
Oral Cavity and Pharynx Cancer Incidence Rate County: Kings
10.9
Cases per 100,000 population
(2016-2020)
Compared to:
CA Counties
The distribution is based on data from 54 California counties.
U.S. Counties
The distribution is based on data from 1,706 U.S. counties and county equivalents.
CA Value
(10.1)
The regional value is compared to the California state value.
US Value
(11.9)
The regional value is compared to the national value.
Prior Value
(9.5)
Prior Value compares a measured value with the previously measured value. Confidence intervals were taken into account in determining the direction of the comparison.
Trend
This comparison measures the indicator’s values over multiple time periods.<br>The Mann-Kendall Test for Statistical Significance is used to evaluate the trend<br>over 4 to 10 periods of measure, subject to data availability and comparability.
Prostate Cancer Incidence Rate County: Kings
Prostate Cancer Incidence Rate County: Kings
86.5
Cases per 100,000 males
(2016-2020)
Compared to:
CA Counties
The distribution is based on data from 57 California counties.
U.S. Counties
The distribution is based on data from 2,500 U.S. counties and county equivalents.
CA Value
(95.4)
The regional value is compared to the California state value.
US Value
(110.5)
The regional value is compared to the national value.
Prior Value
(84.6)
Prior Value compares a measured value with the previously measured value. Confidence intervals were taken into account in determining the direction of the comparison.
Trend
This comparison measures the indicator’s values over multiple time periods.<br>The Mann-Kendall Test for Statistical Significance is used to evaluate the trend<br>over 4 to 10 periods of measure, subject to data availability and comparability.
Health / Children's Health
Child and Teen Fruit Consumption County: Kings
Child and Teen Fruit Consumption County: Kings
57.3%
(2019-2020)
Compared to:
CA Counties
The distribution is based on data from 58 California counties.
CA Value
(69.8%)
The regional value is compared to the California state value.
Prior Value
(60.9%)
Prior Value compares a measured value with the previously measured value. Confidence intervals were taken into account in determining the direction of the comparison.
Trend
This comparison measures the indicator’s values over multiple time periods.<br>The Mann-Kendall Test for Statistical Significance is used to evaluate the trend<br>over 4 to 10 periods of measure, subject to data availability and comparability.
Child Care Centers County: Kings
Child Care Centers County: Kings
3.6
Per 1,000 population under age 5
(2022)
Compared to:
CA Counties
The distribution is based on data from 58 California counties.
CA Value
(8.1)
The regional value is compared to the California state value.
US Value
(7.0)
The regional value is compared to the national value.
Prior Value
(3.6)
Prior Value compares a measured value with the previously measured value. Confidence intervals were not taken into account in determining the direction of the comparison.
Child Food Insecurity Rate County: Kings
Child Food Insecurity Rate County: Kings
17.8%
(2021)
Compared to:
CA Counties
The distribution is based on data from 58 California counties.
U.S. Counties
The distribution is based on data from 3,140 U.S. counties and county equivalents.
CA Value
(13.5%)
The regional value is compared to the California state value.
US Value
(12.8%)
The regional value is compared to the national value.
Prior Value
(21.0%)
Prior Value compares a measured value with the previously measured value. Confidence intervals were not taken into account in determining the direction of the comparison.
Trend
This comparison measures the indicator’s values over multiple time periods.<br>The Mann-Kendall Test for Statistical Significance is used to evaluate the trend<br>over 4 to 10 periods of measure, subject to data availability and comparability.
Health / Children's Health
Food Insecure Children Likely Ineligible for Assistance
Value
Compared to:
Food Insecure Children Likely Ineligible for Assistance County: Kings
Food Insecure Children Likely Ineligible for Assistance County: Kings
23%
(2021)
Compared to:

CA Counties
The distribution is based on data from 58 California counties.
U.S. Counties
The distribution is based on data from 3,134 U.S. counties and county equivalents.
CA Value
(34%)
The regional value is compared to the California state value.
US Value
(25%)
The regional value is compared to the national value.
Prior Value
(19%)
Prior Value compares a measured value with the previously measured value. Confidence intervals were not taken into account in determining the direction of the comparison.
Trend
This comparison measures the indicator’s values over multiple time periods.<br>The Mann-Kendall Test for Statistical Significance is used to evaluate the trend<br>over 4 to 10 periods of measure, subject to data availability and comparability.
Number of Summer Meals Served County: Kings
Number of Summer Meals Served County: Kings
62,339
Meals
(2019)
Compared to:
Prior Value
(59,851)
Prior Value compares a measured value with the previously measured value. Confidence intervals were not taken into account in determining the direction of the comparison.
Trend
This comparison measures the indicator’s values over multiple time periods.<br>The Mann-Kendall Test for Statistical Significance is used to evaluate the trend<br>over 4 to 10 periods of measure, subject to data availability and comparability.
Number of Summer Meals Sites County: Kings
Number of Summer Meals Sites County: Kings
28
Sites
(2019)
Compared to:
Prior Value
(27)
Prior Value compares a measured value with the previously measured value. Confidence intervals were not taken into account in determining the direction of the comparison.
Trend
This comparison measures the indicator’s values over multiple time periods.<br>The Mann-Kendall Test for Statistical Significance is used to evaluate the trend<br>over 4 to 10 periods of measure, subject to data availability and comparability.
Projected Child Food Insecurity Rate County: Kings
Projected Child Food Insecurity Rate County: Kings
21.4%
(2021)
Compared to:
CA Counties
The distribution is based on data from 58 California counties.
U.S. Counties
The distribution is based on data from 3,142 U.S. counties and county equivalents.
CA Value
(16.8%)
The regional value is compared to the California state value.
Prior Value
(31.6%)
Prior Value compares a measured value with the previously measured value. Confidence intervals were not taken into account in determining the direction of the comparison.
Substantiated Child Abuse Rate County: Kings
Substantiated Child Abuse Rate County: Kings
6.1
Cases per 1,000 children
(2022)
Compared to:
CA Value
(6.1)
The regional value is compared to the California state value.
US Value
(8.2 in 2021)
The regional value is compared to the national value. The source for the national value is Children's Bureau
Prior Value
(4.7)
Prior Value compares a measured value with the previously measured value. Confidence intervals were not taken into account in determining the direction of the comparison.
Trend
This comparison measures the indicator’s values over multiple time periods.<br>The Mann-Kendall Test for Statistical Significance is used to evaluate the trend<br>over 4 to 10 periods of measure, subject to data availability and comparability.
HP 2030 Target
(8.7)
Health / Diabetes
Adults Who Bought Medications for Diabetes County: Kings
Adults Who Bought Medications for Diabetes County: Kings
11.2%
(2023)
Compared to:


CA Value
(9.5%)
The regional value is compared to the California state value.
US Value
(10.7%)
The regional value is compared to the national value.
Prior Value
(11.0%)
Prior Value compares a measured value with the previously measured value. Confidence intervals were not taken into account in determining the direction of the comparison.
Trend
This comparison measures the indicator’s values over multiple time periods.<br>The Mann-Kendall Test for Statistical Significance is used to evaluate the trend<br>over 4 to 10 periods of measure, subject to data availability and comparability.
Adults with Diabetes County: Kings
Adults with Diabetes County: Kings
7.8%
(2021-2022)
Compared to:
CA Counties
The distribution is based on data from 58 California counties.
CA Value
(10.7%)
The regional value is compared to the California state value.
US Value
(11.5% in 2022)
The regional value is compared to the national value. The source for the national value is Behavioral Risk Factor Surveillance System
Prior Value
(8.2%)
Prior Value compares a measured value with the previously measured value. Confidence intervals were taken into account in determining the direction of the comparison.
Trend
This comparison measures the indicator’s values over multiple time periods.<br>The Mann-Kendall Test for Statistical Significance is used to evaluate the trend<br>over 4 to 10 periods of measure, subject to data availability and comparability.
Age-Adjusted Death Rate due to Diabetes County: Kings
Age-Adjusted Death Rate due to Diabetes County: Kings
23.5
Deaths per 100,000 population
(2019-2021)
Compared to:
CA Counties
The distribution is based on data from 57 California counties.
CA Value
(23.1)
The regional value is compared to the California state value.
US Value
(24.8 in 2020)
The regional value is compared to the national value. The source for the national value is Centers for Disease Control and Prevention
Prior Value
(19.7)
Prior Value compares a measured value with the previously measured value. Confidence intervals were taken into account in determining the direction of the comparison.
Trend
This comparison measures the indicator’s values over multiple time periods.<br>The Mann-Kendall Test for Statistical Significance is used to evaluate the trend<br>over 4 to 10 periods of measure, subject to data availability and comparability.
Diabetes: Medicare Population County: Kings
Diabetes: Medicare Population County: Kings
29.0%
(2022)
Compared to:
CA Counties
The distribution is based on data from 58 California counties.
U.S. Counties
The distribution is based on data from 3,129 U.S. counties and county equivalents.
CA Value
(21.0%)
The regional value is compared to the California state value.
US Value
(24.0%)
The regional value is compared to the national value.
Prior Value
(29.0%)
Prior Value compares a measured value with the previously measured value. Confidence intervals were not taken into account in determining the direction of the comparison.
Trend
This comparison measures the indicator’s values over multiple time periods.<br>The Mann-Kendall Test for Statistical Significance is used to evaluate the trend<br>over 4 to 10 periods of measure, subject to data availability and comparability.
Health / Disabilities
Adults with Disability Living in Poverty County: Kings
Adults with Disability Living in Poverty County: Kings
19.7%
(2018-2022)
Compared to:
CA Counties
The distribution is based on data from 58 California counties.
U.S. Counties
The distribution is based on data from 3,132 U.S. counties and county equivalents.
CA Value
(22.7%)
The regional value is compared to the California state value.
US Value
(24.9%)
The regional value is compared to the national value.
Trend
This comparison measures the indicator’s values over multiple time periods.<br>The Mann-Kendall Test for Statistical Significance is used to evaluate the trend<br>over 4 to 10 periods of measure, subject to data availability and comparability.
Children with a Disability County: Kings
Children with a Disability County: Kings
3.6%
(2018-2022)
Compared to:

CA Value
(3.7%)
The regional value is compared to the California state value.
US Value
(4.5%)
The regional value is compared to the national value.
Trend
This comparison measures the indicator’s values over multiple time periods.<br>The Mann-Kendall Test for Statistical Significance is used to evaluate the trend<br>over 4 to 10 periods of measure, subject to data availability and comparability.
Homeless people with a disability County: Kings
Homeless people with a disability County: Kings
159
People
(2023)
Compared to:
Prior Value
(121)
Prior Value compares a measured value with the previously measured value. Confidence intervals were not taken into account in determining the direction of the comparison.
Trend
This comparison measures the indicator’s values over multiple time periods.<br>The Mann-Kendall Test for Statistical Significance is used to evaluate the trend<br>over 4 to 10 periods of measure, subject to data availability and comparability.
Persons with a Cognitive Difficulty County: Kings
Persons with a Cognitive Difficulty County: Kings
5.4%
(2018-2022)
Compared to:
CA Value
(4.6%)
The regional value is compared to the California state value.
US Value
(5.3%)
The regional value is compared to the national value.
Trend
This comparison measures the indicator’s values over multiple time periods.<br>The Mann-Kendall Test for Statistical Significance is used to evaluate the trend<br>over 4 to 10 periods of measure, subject to data availability and comparability.
Persons with a Disability County: Kings
Persons with a Disability County: Kings
12.4%
(2018-2022)
Compared to:
CA Value
(11.0%)
The regional value is compared to the California state value.
US Value
(12.9%)
The regional value is compared to the national value.
Trend
This comparison measures the indicator’s values over multiple time periods.<br>The Mann-Kendall Test for Statistical Significance is used to evaluate the trend<br>over 4 to 10 periods of measure, subject to data availability and comparability.
Persons with a Hearing Difficulty County: Kings
Persons with a Hearing Difficulty County: Kings
3.5%
(2018-2022)
Compared to:

CA Value
(2.9%)
The regional value is compared to the California state value.
US Value
(3.6%)
The regional value is compared to the national value.
Trend
This comparison measures the indicator’s values over multiple time periods.<br>The Mann-Kendall Test for Statistical Significance is used to evaluate the trend<br>over 4 to 10 periods of measure, subject to data availability and comparability.
Persons with a Self-Care Difficulty County: Kings
Persons with a Self-Care Difficulty County: Kings
2.8%
(2018-2022)
Compared to:
CA Value
(2.7%)
The regional value is compared to the California state value.
US Value
(2.6%)
The regional value is compared to the national value.
Trend
This comparison measures the indicator’s values over multiple time periods.<br>The Mann-Kendall Test for Statistical Significance is used to evaluate the trend<br>over 4 to 10 periods of measure, subject to data availability and comparability.
Persons with a Vision Difficulty County: Kings
Persons with a Vision Difficulty County: Kings
2.3%
(2018-2022)
Compared to:
CA Value
(2.1%)
The regional value is compared to the California state value.
US Value
(2.4%)
The regional value is compared to the national value.
Trend
This comparison measures the indicator’s values over multiple time periods.<br>The Mann-Kendall Test for Statistical Significance is used to evaluate the trend<br>over 4 to 10 periods of measure, subject to data availability and comparability.
Persons with an Ambulatory Difficulty County: Kings
Persons with an Ambulatory Difficulty County: Kings
6.7%
(2018-2022)
Compared to:
CA Value
(5.8%)
The regional value is compared to the California state value.
US Value
(6.7%)
The regional value is compared to the national value.
Trend
This comparison measures the indicator’s values over multiple time periods.<br>The Mann-Kendall Test for Statistical Significance is used to evaluate the trend<br>over 4 to 10 periods of measure, subject to data availability and comparability.
Health / Health Care Access & Quality
Health / Health Care Access & Quality
Adults Delayed or had Difficulty Obtaining Care
Value
Compared to:
Adults Delayed or had Difficulty Obtaining Care County: Kings
Adults Delayed or had Difficulty Obtaining Care County: Kings
22.2%
(2019-2020)
Compared to:
CA Value
(22.0%)
The regional value is compared to the California state value.
Prior Value
(20.8%)
Prior Value compares a measured value with the previously measured value. Confidence intervals were taken into account in determining the direction of the comparison.
Trend
This comparison measures the indicator’s values over multiple time periods.<br>The Mann-Kendall Test for Statistical Significance is used to evaluate the trend<br>over 4 to 10 periods of measure, subject to data availability and comparability.
Health / Health Care Access & Quality
Adults Needing and Receiving Behavioral Health Care Services
Value
Compared to:
Adults Needing and Receiving Behavioral Health Care Services County: Kings
Adults Needing and Receiving Behavioral Health Care Services County: Kings
51.0%
(2021-2022)
Compared to:

CA Counties
The distribution is based on data from 58 California counties.
CA Value
(55.9%)
The regional value is compared to the California state value.
Prior Value
(55.2%)
Prior Value compares a measured value with the previously measured value. Confidence intervals were taken into account in determining the direction of the comparison.
Trend
This comparison measures the indicator’s values over multiple time periods.<br>The Mann-Kendall Test for Statistical Significance is used to evaluate the trend<br>over 4 to 10 periods of measure, subject to data availability and comparability.
Adults who have had a Routine Checkup County: Kings
Adults who have had a Routine Checkup County: Kings
59.6%
(2021)
Compared to:
CA Counties
The distribution is based on data from 58 California counties.
U.S. Counties
The distribution is based on data from 3,074 U.S. counties and county equivalents.
US Value
(73.6%)
The regional value is compared to the national value.
Adults Who Visited an OB/GYN County: Kings
Adults Who Visited an OB/GYN County: Kings
15.3%
(2023)
Compared to:
CA Value
(16.6%)
The regional value is compared to the California state value.
US Value
(15.7%)
The regional value is compared to the national value.
Prior Value
(16.1%)
Prior Value compares a measured value with the previously measured value. Confidence intervals were not taken into account in determining the direction of the comparison.
Trend
This comparison measures the indicator’s values over multiple time periods.<br>The Mann-Kendall Test for Statistical Significance is used to evaluate the trend<br>over 4 to 10 periods of measure, subject to data availability and comparability.
Adults with Health Insurance: 18-64 County: Kings
Adults with Health Insurance: 18-64 County: Kings
90.3%
(2021)
Compared to:
CA Counties
The distribution is based on data from 58 California counties.
U.S. Counties
The distribution is based on data from 3,140 U.S. counties and county equivalents.
CA Value
(90.2%)
The regional value is compared to the California state value.
Prior Value
(88.5%)
Prior Value compares a measured value with the previously measured value. Confidence intervals were taken into account in determining the direction of the comparison.
Trend
This comparison measures the indicator’s values over multiple time periods.<br>The Mann-Kendall Test for Statistical Significance is used to evaluate the trend<br>over 4 to 10 periods of measure, subject to data availability and comparability.
Adults with HMO Health Insurance County: Kings
Adults with HMO Health Insurance County: Kings
12.9%
(2023)
Compared to:
CA Value
(17.3%)
The regional value is compared to the California state value.
US Value
(14.2%)
The regional value is compared to the national value.
Prior Value
(13.4%)
Prior Value compares a measured value with the previously measured value. Confidence intervals were not taken into account in determining the direction of the comparison.
Adults with Medicaid Health Insurance County: Kings
Adults with Medicaid Health Insurance County: Kings
14.6%
(2023)
Compared to:
CA Value
(11.0%)
The regional value is compared to the California state value.
US Value
(11.9%)
The regional value is compared to the national value.
Prior Value
(13.3%)
Prior Value compares a measured value with the previously measured value. Confidence intervals were not taken into account in determining the direction of the comparison.
Trend
This comparison measures the indicator’s values over multiple time periods.<br>The Mann-Kendall Test for Statistical Significance is used to evaluate the trend<br>over 4 to 10 periods of measure, subject to data availability and comparability.
Adults with Medicare Health Insurance County: Kings
Adults with Medicare Health Insurance County: Kings
14.7%
(2023)
Compared to:
CA Value
(16.7%)
The regional value is compared to the California state value.
US Value
(18.6%)
The regional value is compared to the national value.
Prior Value
(17.3%)
Prior Value compares a measured value with the previously measured value. Confidence intervals were not taken into account in determining the direction of the comparison.
Trend
This comparison measures the indicator’s values over multiple time periods.<br>The Mann-Kendall Test for Statistical Significance is used to evaluate the trend<br>over 4 to 10 periods of measure, subject to data availability and comparability.
Adults with Military Health Insurance County: Kings
Adults with Military Health Insurance County: Kings
4.5%
(2023)
Compared to:
CA Value
(3.6%)
The regional value is compared to the California state value.
US Value
(4.6%)
The regional value is compared to the national value.
Prior Value
(5.4%)
Prior Value compares a measured value with the previously measured value. Confidence intervals were not taken into account in determining the direction of the comparison.
Trend
This comparison measures the indicator’s values over multiple time periods.<br>The Mann-Kendall Test for Statistical Significance is used to evaluate the trend<br>over 4 to 10 periods of measure, subject to data availability and comparability.
Adults with Other Health Insurance County: Kings
Adults with Other Health Insurance County: Kings
6.6%
(2023)
Compared to:
CA Value
(6.2%)
The regional value is compared to the California state value.
US Value
(6.2%)
The regional value is compared to the national value.
Prior Value
(6.6%)
Prior Value compares a measured value with the previously measured value. Confidence intervals were not taken into account in determining the direction of the comparison.
Trend
This comparison measures the indicator’s values over multiple time periods.<br>The Mann-Kendall Test for Statistical Significance is used to evaluate the trend<br>over 4 to 10 periods of measure, subject to data availability and comparability.
Adults with POS Health Insurance County: Kings
Adults with POS Health Insurance County: Kings
1.7%
(2023)
Compared to:
CA Value
(2.0%)
The regional value is compared to the California state value.
US Value
(1.9%)
The regional value is compared to the national value.
Prior Value
(1.8%)
Prior Value compares a measured value with the previously measured value. Confidence intervals were not taken into account in determining the direction of the comparison.
Trend
This comparison measures the indicator’s values over multiple time periods.<br>The Mann-Kendall Test for Statistical Significance is used to evaluate the trend<br>over 4 to 10 periods of measure, subject to data availability and comparability.
Adults with PPO Health Insurance County: Kings
Adults with PPO Health Insurance County: Kings
32.0%
(2023)
Compared to:
CA Value
(34.9%)
The regional value is compared to the California state value.
US Value
(33.9%)
The regional value is compared to the national value.
Prior Value
(33.7%)
Prior Value compares a measured value with the previously measured value. Confidence intervals were not taken into account in determining the direction of the comparison.
Trend
This comparison measures the indicator’s values over multiple time periods.<br>The Mann-Kendall Test for Statistical Significance is used to evaluate the trend<br>over 4 to 10 periods of measure, subject to data availability and comparability.
Adults without Health Insurance County: Kings
Adults without Health Insurance County: Kings
17.2%
(2021)
Compared to:
CA Counties
The distribution is based on data from 58 California counties.
U.S. Counties
The distribution is based on data from 3,074 U.S. counties and county equivalents.
US Value
(10.8%)
The regional value is compared to the national value.
Children with Health Insurance County: Kings
Children with Health Insurance County: Kings
95.9%
(2022)
Compared to:
CA Counties
The distribution is based on data from 42 California counties.
U.S. Counties
The distribution is based on data from 828 U.S. counties and county equivalents.
CA Value
(96.8%)
The regional value is compared to the California state value.
US Value
(94.9%)
The regional value is compared to the national value.
Prior Value
(96.2%)
Prior Value compares a measured value with the previously measured value. Confidence intervals were taken into account in determining the direction of the comparison.
Trend
This comparison measures the indicator’s values over multiple time periods.<br>The Mann-Kendall Test for Statistical Significance is used to evaluate the trend<br>over 4 to 10 periods of measure, subject to data availability and comparability.
Health / Health Care Access & Quality
Households that Received Cardiology Medical Services
Value
Compared to:
Households that Received Cardiology Medical Services County: Kings
Households that Received Cardiology Medical Services County: Kings
10.5%
(2023)
Compared to:
CA Value
(10.7%)
The regional value is compared to the California state value.
US Value
(11.8%)
The regional value is compared to the national value.
Prior Value
(10.6%)
Prior Value compares a measured value with the previously measured value. Confidence intervals were not taken into account in determining the direction of the comparison.
Trend
This comparison measures the indicator’s values over multiple time periods.<br>The Mann-Kendall Test for Statistical Significance is used to evaluate the trend<br>over 4 to 10 periods of measure, subject to data availability and comparability.
Health / Health Care Access & Quality
Households that Received Medical Services in an Emergency Room
Value
Compared to:
Households that Received Medical Services in an Emergency Room County: Kings
Households that Received Medical Services in an Emergency Room County: Kings
28.5%
(2023)
Compared to:
CA Value
(26.5%)
The regional value is compared to the California state value.
US Value
(28.0%)
The regional value is compared to the national value.
Prior Value
(29.0%)
Prior Value compares a measured value with the previously measured value. Confidence intervals were not taken into account in determining the direction of the comparison.
Trend
This comparison measures the indicator’s values over multiple time periods.<br>The Mann-Kendall Test for Statistical Significance is used to evaluate the trend<br>over 4 to 10 periods of measure, subject to data availability and comparability.
Health / Health Care Access & Quality
Households that Received Medical Services in an Urgent Care Facility
Value
Compared to:
Households that Received Medical Services in an Urgent Care Facility County: Kings
Households that Received Medical Services in an Urgent Care Facility County: Kings
25.3%
(2023)
Compared to:
CA Value
(26.9%)
The regional value is compared to the California state value.
US Value
(25.9%)
The regional value is compared to the national value.
Prior Value
(25.4%)
Prior Value compares a measured value with the previously measured value. Confidence intervals were not taken into account in determining the direction of the comparison.
Trend
This comparison measures the indicator’s values over multiple time periods.<br>The Mann-Kendall Test for Statistical Significance is used to evaluate the trend<br>over 4 to 10 periods of measure, subject to data availability and comparability.
Health / Health Care Access & Quality
Households that Received Mental Healthcare Services
Value
Compared to:
Households that Received Mental Healthcare Services County: Kings
Households that Received Mental Healthcare Services County: Kings
9.7%
(2023)
Compared to:
CA Value
(9.5%)
The regional value is compared to the California state value.
US Value
(8.8%)
The regional value is compared to the national value.
Prior Value
(9.0%)
Prior Value compares a measured value with the previously measured value. Confidence intervals were not taken into account in determining the direction of the comparison.
Trend
This comparison measures the indicator’s values over multiple time periods.<br>The Mann-Kendall Test for Statistical Significance is used to evaluate the trend<br>over 4 to 10 periods of measure, subject to data availability and comparability.
Health / Health Care Access & Quality
Households that Received Pediatric Medical Services
Value
Compared to:
Households that Received Pediatric Medical Services County: Kings
Households that Received Pediatric Medical Services County: Kings
12.0%
(2023)
Compared to:
CA Value
(11.8%)
The regional value is compared to the California state value.
US Value
(10.8%)
The regional value is compared to the national value.
Prior Value
(11.4%)
Prior Value compares a measured value with the previously measured value. Confidence intervals were not taken into account in determining the direction of the comparison.
Trend
This comparison measures the indicator’s values over multiple time periods.<br>The Mann-Kendall Test for Statistical Significance is used to evaluate the trend<br>over 4 to 10 periods of measure, subject to data availability and comparability.
Health / Health Care Access & Quality
Households that Received Substance Abuse Medical Services
Value
Compared to:
Households that Received Substance Abuse Medical Services County: Kings
Households that Received Substance Abuse Medical Services County: Kings
1.7%
(2023)
Compared to:
CA Value
(1.3%)
The regional value is compared to the California state value.
US Value
(1.3%)
The regional value is compared to the national value.
Prior Value
(1.5%)
Prior Value compares a measured value with the previously measured value. Confidence intervals were not taken into account in determining the direction of the comparison.
Trend
This comparison measures the indicator’s values over multiple time periods.<br>The Mann-Kendall Test for Statistical Significance is used to evaluate the trend<br>over 4 to 10 periods of measure, subject to data availability and comparability.
Mental Health Provider Rate County: Kings
Mental Health Provider Rate County: Kings
236
Providers per 100,000 population
(2023)
Compared to:
CA Counties
The distribution is based on data from 58 California counties.
U.S. Counties
The distribution is based on data from 2,956 U.S. counties and county equivalents.
CA Value
(450)
The regional value is compared to the California state value.
Prior Value
(224)
Prior Value compares a measured value with the previously measured value. Confidence intervals were not taken into account in determining the direction of the comparison.
Trend
This comparison measures the indicator’s values over multiple time periods.<br>The Mann-Kendall Test for Statistical Significance is used to evaluate the trend<br>over 4 to 10 periods of measure, subject to data availability and comparability.
Non-Physician Primary Care Provider Rate County: Kings
Non-Physician Primary Care Provider Rate County: Kings
92
Providers per 100,000 population
(2023)
Compared to:
CA Counties
The distribution is based on data from 58 California counties.
U.S. Counties
The distribution is based on data from 3,129 U.S. counties and county equivalents.
CA Value
(87)
The regional value is compared to the California state value.
Prior Value
(86)
Prior Value compares a measured value with the previously measured value. Confidence intervals were not taken into account in determining the direction of the comparison.
Trend
This comparison measures the indicator’s values over multiple time periods.<br>The Mann-Kendall Test for Statistical Significance is used to evaluate the trend<br>over 4 to 10 periods of measure, subject to data availability and comparability.
Health / Health Care Access & Quality
People Delayed or had Difficulty Obtaining Care
Value
Compared to:
People Delayed or had Difficulty Obtaining Care County: Kings
People Delayed or had Difficulty Obtaining Care County: Kings
12.5%
(2021-2022)
Compared to:
CA Counties
The distribution is based on data from 58 California counties.
CA Value
(16.5%)
The regional value is compared to the California state value.
Prior Value
(14.8%)
Prior Value compares a measured value with the previously measured value. Confidence intervals were taken into account in determining the direction of the comparison.
Trend
This comparison measures the indicator’s values over multiple time periods.<br>The Mann-Kendall Test for Statistical Significance is used to evaluate the trend<br>over 4 to 10 periods of measure, subject to data availability and comparability.
HP 2030 Target
(5.9%)
People with a Usual Source of Health Care County: Kings
People with a Usual Source of Health Care County: Kings
85.1%
(2022)
Compared to:
CA Counties
The distribution is based on data from 58 California counties.
CA Value
(82.5%)
The regional value is compared to the California state value.
Prior Value
(85.7%)
Prior Value compares a measured value with the previously measured value. Confidence intervals were taken into account in determining the direction of the comparison.
Trend
This comparison measures the indicator’s values over multiple time periods.<br>The Mann-Kendall Test for Statistical Significance is used to evaluate the trend<br>over 4 to 10 periods of measure, subject to data availability and comparability.
Persons with Health Insurance County: Kings
Persons with Health Insurance County: Kings
92.4%
(2021)
Compared to:
CA Counties
The distribution is based on data from 58 California counties.
U.S. Counties
The distribution is based on data from 3,140 U.S. counties and county equivalents.
CA Value
(91.9%)
The regional value is compared to the California state value.
Prior Value
(91.1%)
Prior Value compares a measured value with the previously measured value. Confidence intervals were taken into account in determining the direction of the comparison.
Trend
This comparison measures the indicator’s values over multiple time periods.<br>The Mann-Kendall Test for Statistical Significance is used to evaluate the trend<br>over 4 to 10 periods of measure, subject to data availability and comparability.
HP 2030 Target
(92.4%)
<div>AHS-01: Increase the proportion of people with health insurance <strong>(LEADING HEALTH INDICATOR)</strong></div>
Persons with Private Health Insurance Only County: Kings
Persons with Private Health Insurance Only County: Kings
46.7%
(2022)
Compared to:
CA Value
(53.5%)
The regional value is compared to the California state value.
US Value
(54.8%)
The regional value is compared to the national value.
Prior Value
(48.5%)
Prior Value compares a measured value with the previously measured value. Confidence intervals were not taken into account in determining the direction of the comparison.
Trend
This comparison measures the indicator’s values over multiple time periods.<br>The Mann-Kendall Test for Statistical Significance is used to evaluate the trend<br>over 4 to 10 periods of measure, subject to data availability and comparability.
Persons with Public Health Insurance Only County: Kings
Persons with Public Health Insurance Only County: Kings
37.1%
(2022)
Compared to:
CA Value
(29.8%)
The regional value is compared to the California state value.
US Value
(24.8%)
The regional value is compared to the national value.
Prior Value
(36.8%)
Prior Value compares a measured value with the previously measured value. Confidence intervals were not taken into account in determining the direction of the comparison.
Trend
This comparison measures the indicator’s values over multiple time periods.<br>The Mann-Kendall Test for Statistical Significance is used to evaluate the trend<br>over 4 to 10 periods of measure, subject to data availability and comparability.
Health / Health Care Access & Quality
Preventable Hospital Stays: Medicare Population
Value
Compared to:
Preventable Hospital Stays: Medicare Population County: Kings
Preventable Hospital Stays: Medicare Population County: Kings
2,474.0
Discharges per 100,000 Medicare enrollees
(2022)
Compared to:
CA Counties
The distribution is based on data from 58 California counties.
U.S. Counties
The distribution is based on data from 3,129 U.S. counties and county equivalents.
CA Value
(2,275.0)
The regional value is compared to the California state value.
US Value
(2,677.0)
The regional value is compared to the national value.
Prior Value
(2,628.0)
Prior Value compares a measured value with the previously measured value. Confidence intervals were not taken into account in determining the direction of the comparison.
Trend
This comparison measures the indicator’s values over multiple time periods.<br>The Mann-Kendall Test for Statistical Significance is used to evaluate the trend<br>over 4 to 10 periods of measure, subject to data availability and comparability.
Primary Care Provider Rate County: Kings
Primary Care Provider Rate County: Kings
37
Providers per 100,000 population
(2021)
Compared to:


CA Counties
The distribution is based on data from 57 California counties.
U.S. Counties
The distribution is based on data from 2,984 U.S. counties and county equivalents.
CA Value
(81)
The regional value is compared to the California state value.
Prior Value
(38)
Prior Value compares a measured value with the previously measured value. Confidence intervals were not taken into account in determining the direction of the comparison.
Trend
This comparison measures the indicator’s values over multiple time periods.<br>The Mann-Kendall Test for Statistical Significance is used to evaluate the trend<br>over 4 to 10 periods of measure, subject to data availability and comparability.
Health / Health Care Access & Quality
Respondents Who Are Able to Access Medical Services
Value
Compared to:
Respondents Who Are Able to Access Medical Services County: Kings
Respondents Who Are Able to Access Medical Services County: Kings
92.2%
(2023)
Compared to:
Prior Value
(94.0%)
Prior Value compares a measured value with the previously measured value. Confidence intervals were not taken into account in determining the direction of the comparison.
Trend
This comparison measures the indicator’s values over multiple time periods.<br>The Mann-Kendall Test for Statistical Significance is used to evaluate the trend<br>over 4 to 10 periods of measure, subject to data availability and comparability.
Kings County 2023 Target
(96.0%)
Health / Health Care Access & Quality
Respondents who are Able to Access Mental Health Services
Value
Compared to:
Respondents who are Able to Access Mental Health Services County: Kings
Respondents who are Able to Access Mental Health Services County: Kings
70.9%
(2023)
Compared to:
Prior Value
(55.2%)
Prior Value compares a measured value with the previously measured value. Confidence intervals were not taken into account in determining the direction of the comparison.
Health / Health Care Access & Quality
Respondents who are Able to Access Telehealth Services
Value
Compared to:
Respondents who are Able to Access Telehealth Services County: Kings
Respondents who are Able to Access Telehealth Services County: Kings
79.9%
(2023)
Compared to:
Prior Value
(31.7%)
Prior Value compares a measured value with the previously measured value. Confidence intervals were not taken into account in determining the direction of the comparison.
Health / Health Care Access & Quality
Respondents who are Aware of Free to Low-Cost Family Planning Services in the Community
Value
Compared to:
Respondents who are Aware of Free to Low-Cost Family Planning Services in the Community County: Kings
Respondents who are Aware of Free to Low-Cost Family Planning Services in the Community County: Kings
58.2%
(2023)
Compared to:
Prior Value
(44.2%)
Prior Value compares a measured value with the previously measured value. Confidence intervals were not taken into account in determining the direction of the comparison.
Kings County 2023 Target
(55.2%)
Health / Health Care Access & Quality
Respondents who are unable to access medical services due to a lack of childcare
Value
Compared to:
Respondents who are unable to access medical services due to a lack of childcare County: Kings
Respondents who are unable to access medical services due to a lack of childcare County: Kings
4.3%
(2023)
Compared to:
Prior Value
(8.5%)
Prior Value compares a measured value with the previously measured value. Confidence intervals were not taken into account in determining the direction of the comparison.
Trend
This comparison measures the indicator’s values over multiple time periods.<br>The Mann-Kendall Test for Statistical Significance is used to evaluate the trend<br>over 4 to 10 periods of measure, subject to data availability and comparability.
Health / Health Care Access & Quality
Respondents who are unable to access medical services due to a lack of local specialists
Value
Compared to:
Respondents who are unable to access medical services due to a lack of local specialists County: Kings
Respondents who are unable to access medical services due to a lack of local specialists County: Kings
36.7%
(2023)
Compared to:
Prior Value
(14.9%)
Prior Value compares a measured value with the previously measured value. Confidence intervals were not taken into account in determining the direction of the comparison.
Health / Health Care Access & Quality
Respondents who are unable to access medical services due to finances
Value
Compared to:
Respondents who are unable to access medical services due to finances County: Kings
Respondents who are unable to access medical services due to finances County: Kings
17.6%
(2023)
Compared to:
Prior Value
(17.0%)
Prior Value compares a measured value with the previously measured value. Confidence intervals were not taken into account in determining the direction of the comparison.
Trend
This comparison measures the indicator’s values over multiple time periods.<br>The Mann-Kendall Test for Statistical Significance is used to evaluate the trend<br>over 4 to 10 periods of measure, subject to data availability and comparability.
Health / Health Care Access & Quality
Respondents who are unable to access medical services due to having no insurance
Value
Compared to:
Respondents who are unable to access medical services due to having no insurance County: Kings
Respondents who are unable to access medical services due to having no insurance County: Kings
22.9%
(2023)
Compared to:
Prior Value
(48.9%)
Prior Value compares a measured value with the previously measured value. Confidence intervals were not taken into account in determining the direction of the comparison.
Health / Health Care Access & Quality
Respondents who are unable to access medical services due to healthcare hours
Value
Compared to:
Respondents who are unable to access medical services due to healthcare hours County: Kings
Respondents who are unable to access medical services due to healthcare hours County: Kings
46.3%
(2023)
Compared to:
Prior Value
(10.6%)
Prior Value compares a measured value with the previously measured value. Confidence intervals were not taken into account in determining the direction of the comparison.
Trend
This comparison measures the indicator’s values over multiple time periods.<br>The Mann-Kendall Test for Statistical Significance is used to evaluate the trend<br>over 4 to 10 periods of measure, subject to data availability and comparability.
Health / Health Care Access & Quality
Respondents who are unable to access medical services due to lack of transportation
Value
Compared to:
Respondents who are unable to access medical services due to lack of transportation County: Kings
Respondents who are unable to access medical services due to lack of transportation County: Kings
37.2%
(2023)
Compared to:
Prior Value
(6.4%)
Prior Value compares a measured value with the previously measured value. Confidence intervals were not taken into account in determining the direction of the comparison.
Trend
This comparison measures the indicator’s values over multiple time periods.<br>The Mann-Kendall Test for Statistical Significance is used to evaluate the trend<br>over 4 to 10 periods of measure, subject to data availability and comparability.
Health / Health Care Access & Quality
Respondents who are unable to access medical services due to scheduling conflicts
Value
Compared to:
Respondents who are unable to access medical services due to scheduling conflicts County: Kings
Respondents who are unable to access medical services due to scheduling conflicts County: Kings
30.9%
(2023)
Compared to:
Prior Value
(19.2%)
Prior Value compares a measured value with the previously measured value. Confidence intervals were not taken into account in determining the direction of the comparison.
Trend
This comparison measures the indicator’s values over multiple time periods.<br>The Mann-Kendall Test for Statistical Significance is used to evaluate the trend<br>over 4 to 10 periods of measure, subject to data availability and comparability.
Health / Health Care Access & Quality
Respondents who are unable to access mental health services due to a lack of childcare
Value
Compared to:
Respondents who are unable to access mental health services due to a lack of childcare County: Kings
Respondents who are unable to access mental health services due to a lack of childcare County: Kings
20.4%
(2023)
Compared to:
Prior Value
(6.8%)
Prior Value compares a measured value with the previously measured value. Confidence intervals were not taken into account in determining the direction of the comparison.
Health / Health Care Access & Quality
Respondents who are unable to access mental health services due to an inability to find a provider
Value
Compared to:
Respondents who are unable to access mental health services due to an inability to find a provider County: Kings
Respondents who are unable to access mental health services due to an inability to find a provider County: Kings
37.9%
(2023)
Compared to:
Prior Value
(45.8%)
Prior Value compares a measured value with the previously measured value. Confidence intervals were not taken into account in determining the direction of the comparison.
Health / Health Care Access & Quality
Respondents who are unable to access mental health services due to finances
Value
Compared to:
Respondents who are unable to access mental health services due to finances County: Kings
Respondents who are unable to access mental health services due to finances County: Kings
34.5%
(2023)
Compared to:
Prior Value
(13.6%)
Prior Value compares a measured value with the previously measured value. Confidence intervals were not taken into account in determining the direction of the comparison.
Health / Health Care Access & Quality
Respondents who are unable to access mental health services due to having no insurance
Value
Compared to:
Respondents who are unable to access mental health services due to having no insurance County: Kings
Respondents who are unable to access mental health services due to having no insurance County: Kings
21.8%
(2023)
Compared to:
Prior Value
(25.4%)
Prior Value compares a measured value with the previously measured value. Confidence intervals were not taken into account in determining the direction of the comparison.
Health / Health Care Access & Quality
Respondents who are unable to access mental health services due to lack of transportation
Value
Compared to:
Respondents who are unable to access mental health services due to lack of transportation County: Kings
Respondents who are unable to access mental health services due to lack of transportation County: Kings
26.2%
(2023)
Compared to:
Prior Value
(3.4%)
Prior Value compares a measured value with the previously measured value. Confidence intervals were not taken into account in determining the direction of the comparison.
Health / Health Care Access & Quality
Respondents who are unable to access mental health services due to not being covered by insurance
Value
Compared to:
Respondents who are unable to access mental health services due to not being covered by insurance County: Kings
Respondents who are unable to access mental health services due to not being covered by insurance County: Kings
10.7%
(2023)
Compared to:
Prior Value
(25.4%)
Prior Value compares a measured value with the previously measured value. Confidence intervals were not taken into account in determining the direction of the comparison.
Health / Health Care Access & Quality
Respondents who are unable to access mental health services due to provider hours
Value
Compared to:
Respondents who are unable to access mental health services due to provider hours County: Kings
Respondents who are unable to access mental health services due to provider hours County: Kings
33.0%
(2023)
Compared to:
Prior Value
(13.6%)
Prior Value compares a measured value with the previously measured value. Confidence intervals were not taken into account in determining the direction of the comparison.
Health / Health Care Access & Quality
Respondents who are unable to access mental health services due to stigma
Value
Compared to:
Respondents who are unable to access mental health services due to stigma County: Kings
Respondents who are unable to access mental health services due to stigma County: Kings
22.8%
(2023)
Compared to:
Prior Value
(13.6%)
Prior Value compares a measured value with the previously measured value. Confidence intervals were not taken into account in determining the direction of the comparison.
Health / Health Care Access & Quality
Respondents who are unable to access telehealth services due to finances
Value
Compared to:
Respondents who are unable to access telehealth services due to finances County: Kings
Respondents who are unable to access telehealth services due to finances County: Kings
17.2%
(2023)
Compared to:
Prior Value
(8.2%)
Prior Value compares a measured value with the previously measured value. Confidence intervals were not taken into account in determining the direction of the comparison.
Health / Health Care Access & Quality
Respondents who are unable to access telehealth services due to having no cell phone
Value
Compared to:
Respondents who are unable to access telehealth services due to having no cell phone County: Kings
Respondents who are unable to access telehealth services due to having no cell phone County: Kings
28.3%
(2023)
Compared to:
Prior Value
(8.2%)
Prior Value compares a measured value with the previously measured value. Confidence intervals were not taken into account in determining the direction of the comparison.
Health / Health Care Access & Quality
Respondents who are unable to access telehealth services due to having no computer
Value
Compared to:
Respondents who are unable to access telehealth services due to having no computer County: Kings
Respondents who are unable to access telehealth services due to having no computer County: Kings
17.8%
(2023)
Compared to:
Prior Value
(28.6%)
Prior Value compares a measured value with the previously measured value. Confidence intervals were not taken into account in determining the direction of the comparison.
Health / Health Care Access & Quality
Respondents who are unable to access telehealth services due to having no internet service
Value
Compared to:
Respondents who are unable to access telehealth services due to having no internet service County: Kings
Respondents who are unable to access telehealth services due to having no internet service County: Kings
21.1%
(2023)
Compared to:
Prior Value
(10.2%)
Prior Value compares a measured value with the previously measured value. Confidence intervals were not taken into account in determining the direction of the comparison.
Health / Health Care Access & Quality
Respondents who are unable to access telehealth services due to lack of privacy
Value
Compared to:
Respondents who are unable to access telehealth services due to lack of privacy County: Kings
Respondents who are unable to access telehealth services due to lack of privacy County: Kings
20.6%
(2023)
Compared to:
Prior Value
(18.4%)
Prior Value compares a measured value with the previously measured value. Confidence intervals were not taken into account in determining the direction of the comparison.
Health / Health Care Access & Quality
Respondents who are unable to access telehealth services due to not feeling secure
Value
Compared to:
Respondents who are unable to access telehealth services due to not feeling secure County: Kings
Respondents who are unable to access telehealth services due to not feeling secure County: Kings
9.4%
(2023)
Compared to:
Prior Value
(12.2%)
Prior Value compares a measured value with the previously measured value. Confidence intervals were not taken into account in determining the direction of the comparison.
Health / Health Care Access & Quality
Respondents who are unable to access telehealth services due to provider hours
Value
Compared to:
Respondents who are unable to access telehealth services due to provider hours County: Kings
Respondents who are unable to access telehealth services due to provider hours County: Kings
42.2%
(2023)
Compared to:
Prior Value
(10.2%)
Prior Value compares a measured value with the previously measured value. Confidence intervals were not taken into account in determining the direction of the comparison.
Health / Health Care Access & Quality
Respondents who are unable to access telehealth services due to stigma
Value
Compared to:
Respondents who are unable to access telehealth services due to stigma County: Kings
Respondents who are unable to access telehealth services due to stigma County: Kings
13.9%
(2023)
Compared to:
Prior Value
(4.1%)
Prior Value compares a measured value with the previously measured value. Confidence intervals were not taken into account in determining the direction of the comparison.
Health / Health Care Access & Quality
Respondents who are unable to access telehealth services due to the service being impersonal
Value
Compared to:
Respondents who are unable to access telehealth services due to the service being impersonal County: Kings
Respondents who are unable to access telehealth services due to the service being impersonal County: Kings
22.8%
(2023)
Compared to:
Prior Value
(14.3%)
Prior Value compares a measured value with the previously measured value. Confidence intervals were not taken into account in determining the direction of the comparison.
Health / Health Care Access & Quality
Respondents who Have Used Mental Health Services in the Community
Value
Compared to:
Respondents who Have Used Mental Health Services in the Community County: Kings
Respondents who Have Used Mental Health Services in the Community County: Kings
30.9%
(2023)
Compared to:
Prior Value
(14.1%)
Prior Value compares a measured value with the previously measured value. Confidence intervals were not taken into account in determining the direction of the comparison.
Trend
This comparison measures the indicator’s values over multiple time periods.<br>The Mann-Kendall Test for Statistical Significance is used to evaluate the trend<br>over 4 to 10 periods of measure, subject to data availability and comparability.
Health / Health Care Access & Quality
Respondents who need assistance with accessing medical coverage
Value
Compared to:
Respondents who need assistance with accessing medical coverage County: Kings
Respondents who need assistance with accessing medical coverage County: Kings
14.4%
(2023)
Compared to:
Prior Value
(4.8%)
Prior Value compares a measured value with the previously measured value. Confidence intervals were not taken into account in determining the direction of the comparison.
Health / Health Care Access & Quality
Respondents Who Stated Their Families Are Covered by Health Insurance
Value
Compared to:
Respondents Who Stated Their Families Are Covered by Health Insurance County: Kings
Respondents Who Stated Their Families Are Covered by Health Insurance County: Kings
86.9%
(2023)
Compared to:
Prior Value
(91.2%)
Prior Value compares a measured value with the previously measured value. Confidence intervals were not taken into account in determining the direction of the comparison.
Trend
This comparison measures the indicator’s values over multiple time periods.<br>The Mann-Kendall Test for Statistical Significance is used to evaluate the trend<br>over 4 to 10 periods of measure, subject to data availability and comparability.
Kings County 2023 Target
(87.0%)
Health / Health Care Access & Quality
Respondents whose Household Experienced Reduced Work Hours of Wages due to the COVID Pandemic
Value
Compared to:
Respondents whose Household Experienced Reduced Work Hours of Wages due to the COVID Pandemic County: Kings
Respondents whose Household Experienced Reduced Work Hours of Wages due to the COVID Pandemic County: Kings
24.4%
(2021)
Compared to:
No Comparison Data Available
(0%)
Health / Health Information Technology
Health / Health Information Technology
Adults Who Access Medical Services and Information through the Internet
Value
Compared to:
Adults Who Access Medical Services and Information through the Internet County: Kings
Adults Who Access Medical Services and Information through the Internet County: Kings
28.5%
(2023)
Compared to:
CA Value
(33.1%)
The regional value is compared to the California state value.
US Value
(31.8%)
The regional value is compared to the national value.
Prior Value
(32.6%)
Prior Value compares a measured value with the previously measured value. Confidence intervals were not taken into account in determining the direction of the comparison.
Households with a Smartphone County: Kings
Households with a Smartphone County: Kings
85.0%
(2023)
Compared to:
CA Counties
The distribution is based on data from 58 California counties.
U.S. Counties
The distribution is based on data from 3,141 U.S. counties and county equivalents.
CA Value
(86.7%)
The regional value is compared to the California state value.
US Value
(84.7%)
The regional value is compared to the national value.
Prior Value
(84.4%)
Prior Value compares a measured value with the previously measured value. Confidence intervals were not taken into account in determining the direction of the comparison.
Trend
This comparison measures the indicator’s values over multiple time periods.<br>The Mann-Kendall Test for Statistical Significance is used to evaluate the trend<br>over 4 to 10 periods of measure, subject to data availability and comparability.
Households with an Internet Subscription County: Kings
Households with an Internet Subscription County: Kings
86.8%
(2018-2022)
Compared to:
CA Counties
The distribution is based on data from 58 California counties.
U.S. Counties
The distribution is based on data from 3,133 U.S. counties and county equivalents.
CA Value
(91.6%)
The regional value is compared to the California state value.
US Value
(88.5%)
The regional value is compared to the national value.
Trend
This comparison measures the indicator’s values over multiple time periods.<br>The Mann-Kendall Test for Statistical Significance is used to evaluate the trend<br>over 4 to 10 periods of measure, subject to data availability and comparability.
Health / Health Information Technology
Households with One or More Types of Computing Devices
Value
Compared to:
Households with One or More Types of Computing Devices County: Kings
Households with One or More Types of Computing Devices County: Kings
93.8%
(2018-2022)
Compared to:
CA Counties
The distribution is based on data from 58 California counties.
U.S. Counties
The distribution is based on data from 3,133 U.S. counties and county equivalents.
CA Value
(95.9%)
The regional value is compared to the California state value.
US Value
(94.0%)
The regional value is compared to the national value.
Trend
This comparison measures the indicator’s values over multiple time periods.<br>The Mann-Kendall Test for Statistical Significance is used to evaluate the trend<br>over 4 to 10 periods of measure, subject to data availability and comparability.
Persons with an Internet Subscription County: Kings
Persons with an Internet Subscription County: Kings
89.1%
(2018-2022)
Compared to:
CA Counties
The distribution is based on data from 58 California counties.
U.S. Counties
The distribution is based on data from 3,133 U.S. counties and county equivalents.
CA Value
(93.4%)
The regional value is compared to the California state value.
US Value
(91.0%)
The regional value is compared to the national value.
Trend
This comparison measures the indicator’s values over multiple time periods.<br>The Mann-Kendall Test for Statistical Significance is used to evaluate the trend<br>over 4 to 10 periods of measure, subject to data availability and comparability.
Health / Health Information Technology
Respondents who Stated they Have Internet Access in their Home
Value
Compared to:
Respondents who Stated they Have Internet Access in their Home County: Kings
Respondents who Stated they Have Internet Access in their Home County: Kings
89.0%
(2023)
Compared to:
Prior Value
(94.2%)
Prior Value compares a measured value with the previously measured value. Confidence intervals were not taken into account in determining the direction of the comparison.
Trend
This comparison measures the indicator’s values over multiple time periods.<br>The Mann-Kendall Test for Statistical Significance is used to evaluate the trend<br>over 4 to 10 periods of measure, subject to data availability and comparability.
Kings County 2023 Target
(70.7%)
Health / Heart Disease & Stroke
Adults Who Bought Medications for Cholesterol County: Kings
Adults Who Bought Medications for Cholesterol County: Kings
15.3%
(2023)
Compared to:
CA Value
(15.8%)
The regional value is compared to the California state value.
US Value
(17.1%)
The regional value is compared to the national value.
Prior Value
(15.3%)
Prior Value compares a measured value with the previously measured value. Confidence intervals were not taken into account in determining the direction of the comparison.
Trend
This comparison measures the indicator’s values over multiple time periods.<br>The Mann-Kendall Test for Statistical Significance is used to evaluate the trend<br>over 4 to 10 periods of measure, subject to data availability and comparability.
Adults who Experienced a Stroke County: Kings
Adults who Experienced a Stroke County: Kings
3.0%
(2021)
Compared to:
CA Counties
The distribution is based on data from 58 California counties.
U.S. Counties
The distribution is based on data from 3,074 U.S. counties and county equivalents.
US Value
(3.3%)
The regional value is compared to the national value.
Adults who Experienced Coronary Heart Disease County: Kings
Adults who Experienced Coronary Heart Disease County: Kings
5.5%
(2021)
Compared to:
CA Counties
The distribution is based on data from 58 California counties.
U.S. Counties
The distribution is based on data from 3,074 U.S. counties and county equivalents.
US Value
(6.1%)
The regional value is compared to the national value.
Health / Heart Disease & Stroke
Adults who Have Taken Medications for High Blood Pressure
Value
Compared to:
Adults who Have Taken Medications for High Blood Pressure County: Kings
Adults who Have Taken Medications for High Blood Pressure County: Kings
69.2%
(2021)
Compared to:
CA Counties
The distribution is based on data from 58 California counties.
U.S. Counties
The distribution is based on data from 3,074 U.S. counties and county equivalents.
US Value
(78.2%)
The regional value is compared to the national value.
Adults Who Visited a Cardiologist County: Kings
Adults Who Visited a Cardiologist County: Kings
10.9%
(2023)
Compared to:
CA Value
(12.4%)
The regional value is compared to the California state value.
US Value
(13.2%)
The regional value is compared to the national value.
Prior Value
(12.0%)
Prior Value compares a measured value with the previously measured value. Confidence intervals were not taken into account in determining the direction of the comparison.
Trend
This comparison measures the indicator’s values over multiple time periods.<br>The Mann-Kendall Test for Statistical Significance is used to evaluate the trend<br>over 4 to 10 periods of measure, subject to data availability and comparability.
Adults with Heart Disease County: Kings
Adults with Heart Disease County: Kings
6.3%
(2019-2020)
Compared to:
CA Value
(6.9%)
The regional value is compared to the California state value.
Prior Value
(6.4%)
Prior Value compares a measured value with the previously measured value. Confidence intervals were taken into account in determining the direction of the comparison.
Trend
This comparison measures the indicator’s values over multiple time periods.<br>The Mann-Kendall Test for Statistical Significance is used to evaluate the trend<br>over 4 to 10 periods of measure, subject to data availability and comparability.
Health / Heart Disease & Stroke
Age-Adjusted Death Rate due to Cerebrovascular Disease (Stroke)
Value
Compared to:
Age-Adjusted Death Rate due to Cerebrovascular Disease (Stroke) County: Kings
Age-Adjusted Death Rate due to Cerebrovascular Disease (Stroke) County: Kings
44.3
Deaths per 100,000 population
(2019-2021)
Compared to:
CA Counties
The distribution is based on data from 58 California counties.
CA Value
(37.2)
The regional value is compared to the California state value.
US Value
(38.8 in 2020)
The regional value is compared to the national value. The source for the national value is Centers for Disease Control and Prevention
Prior Value
(40.0)
Prior Value compares a measured value with the previously measured value. Confidence intervals were taken into account in determining the direction of the comparison.
Trend
This comparison measures the indicator’s values over multiple time periods.<br>The Mann-Kendall Test for Statistical Significance is used to evaluate the trend<br>over 4 to 10 periods of measure, subject to data availability and comparability.
HP 2030 Target
(33.4)
Health / Heart Disease & Stroke
Age-Adjusted Death Rate due to Coronary Heart Disease
Value
Compared to:
Age-Adjusted Death Rate due to Coronary Heart Disease County: Kings
Age-Adjusted Death Rate due to Coronary Heart Disease County: Kings
104.7
Deaths per 100,000 population
(2019-2021)
Compared to:
CA Counties
The distribution is based on data from 58 California counties.
CA Value
(79.0)
The regional value is compared to the California state value.
US Value
(91.8 in 2020)
The regional value is compared to the national value. The source for the national value is Centers for Disease Control and Prevention
Prior Value
(107.8)
Prior Value compares a measured value with the previously measured value. Confidence intervals were taken into account in determining the direction of the comparison.
Trend
This comparison measures the indicator’s values over multiple time periods.<br>The Mann-Kendall Test for Statistical Significance is used to evaluate the trend<br>over 4 to 10 periods of measure, subject to data availability and comparability.
HP 2030 Target
(71.1)
Age-Adjusted Death Rate due to Heart Attack County: Kings
Age-Adjusted Death Rate due to Heart Attack County: Kings
57.5
Deaths per 100,000 population 35+ years
(2020)
Compared to:
CA Counties
The distribution is based on data from 49 California counties.
CA Value
(44.4)
The regional value is compared to the California state value.
Prior Value
(53.1)
Prior Value compares a measured value with the previously measured value. Confidence intervals were not taken into account in determining the direction of the comparison.
Trend
This comparison measures the indicator’s values over multiple time periods.<br>The Mann-Kendall Test for Statistical Significance is used to evaluate the trend<br>over 4 to 10 periods of measure, subject to data availability and comparability.
Atrial Fibrillation: Medicare Population County: Kings
Atrial Fibrillation: Medicare Population County: Kings
10.0%
(2022)
Compared to:
CA Counties
The distribution is based on data from 58 California counties.
U.S. Counties
The distribution is based on data from 3,129 U.S. counties and county equivalents.
CA Value
(13.0%)
The regional value is compared to the California state value.
US Value
(14.0%)
The regional value is compared to the national value.
Prior Value
(10.0%)
Prior Value compares a measured value with the previously measured value. Confidence intervals were not taken into account in determining the direction of the comparison.
Trend
This comparison measures the indicator’s values over multiple time periods.<br>The Mann-Kendall Test for Statistical Significance is used to evaluate the trend<br>over 4 to 10 periods of measure, subject to data availability and comparability.
Cholesterol Test History County: Kings
Cholesterol Test History County: Kings
79.8%
(2021)
Compared to:
CA Counties
The distribution is based on data from 58 California counties.
U.S. Counties
The distribution is based on data from 3,074 U.S. counties and county equivalents.
US Value
(86.4%)
The regional value is compared to the national value.
Heart Failure: Medicare Population County: Kings
Heart Failure: Medicare Population County: Kings
16.0%
(2022)
Compared to:
CA Counties
The distribution is based on data from 58 California counties.
U.S. Counties
The distribution is based on data from 3,129 U.S. counties and county equivalents.
CA Value
(10.0%)
The regional value is compared to the California state value.
US Value
(11.0%)
The regional value is compared to the national value.
Prior Value
(16.0%)
Prior Value compares a measured value with the previously measured value. Confidence intervals were not taken into account in determining the direction of the comparison.
Trend
This comparison measures the indicator’s values over multiple time periods.<br>The Mann-Kendall Test for Statistical Significance is used to evaluate the trend<br>over 4 to 10 periods of measure, subject to data availability and comparability.
High Blood Pressure Prevalence County: Kings
High Blood Pressure Prevalence County: Kings
34.8%
(2022)
Compared to:
CA Counties
The distribution is based on data from 58 California counties.
CA Value
(34.8%)
The regional value is compared to the California state value.
US Value
(32.4% in 2021)
The regional value is compared to the national value. The source for the national value is Behavioral Risk Factor Surveillance System
Prior Value
(22.5%)
Prior Value compares a measured value with the previously measured value. Confidence intervals were taken into account in determining the direction of the comparison.
Trend
This comparison measures the indicator’s values over multiple time periods.<br>The Mann-Kendall Test for Statistical Significance is used to evaluate the trend<br>over 4 to 10 periods of measure, subject to data availability and comparability.
HP 2030 Target
(41.9%)
High Cholesterol Prevalence: Past 5 Years County: Kings
High Cholesterol Prevalence: Past 5 Years County: Kings
33.4%
(2021)
Compared to:
CA Counties
The distribution is based on data from 58 California counties.
U.S. Counties
The distribution is based on data from 3,074 U.S. counties and county equivalents.
US Value
(36.4%)
The regional value is compared to the national value.
Hyperlipidemia: Medicare Population County: Kings
Hyperlipidemia: Medicare Population County: Kings
64.0%
(2022)
Compared to:
CA Counties
The distribution is based on data from 58 California counties.
U.S. Counties
The distribution is based on data from 3,129 U.S. counties and county equivalents.
CA Value
(61.0%)
The regional value is compared to the California state value.
US Value
(65.0%)
The regional value is compared to the national value.
Prior Value
(62.0%)
Prior Value compares a measured value with the previously measured value. Confidence intervals were not taken into account in determining the direction of the comparison.
Trend
This comparison measures the indicator’s values over multiple time periods.<br>The Mann-Kendall Test for Statistical Significance is used to evaluate the trend<br>over 4 to 10 periods of measure, subject to data availability and comparability.
Hypertension: Medicare Population County: Kings
Hypertension: Medicare Population County: Kings
68.0%
(2022)
Compared to:
CA Counties
The distribution is based on data from 58 California counties.
U.S. Counties
The distribution is based on data from 3,129 U.S. counties and county equivalents.
CA Value
(58.0%)
The regional value is compared to the California state value.
US Value
(65.0%)
The regional value is compared to the national value.
Prior Value
(68.0%)
Prior Value compares a measured value with the previously measured value. Confidence intervals were not taken into account in determining the direction of the comparison.
Trend
This comparison measures the indicator’s values over multiple time periods.<br>The Mann-Kendall Test for Statistical Significance is used to evaluate the trend<br>over 4 to 10 periods of measure, subject to data availability and comparability.
Ischemic Heart Disease: Medicare Population County: Kings
Ischemic Heart Disease: Medicare Population County: Kings
24.0%
(2022)
Compared to:
CA Counties
The distribution is based on data from 58 California counties.
U.S. Counties
The distribution is based on data from 3,129 U.S. counties and county equivalents.
CA Value
(18.0%)
The regional value is compared to the California state value.
US Value
(21.0%)
The regional value is compared to the national value.
Prior Value
(23.0%)
Prior Value compares a measured value with the previously measured value. Confidence intervals were not taken into account in determining the direction of the comparison.
Trend
This comparison measures the indicator’s values over multiple time periods.<br>The Mann-Kendall Test for Statistical Significance is used to evaluate the trend<br>over 4 to 10 periods of measure, subject to data availability and comparability.
Stroke: Medicare Population County: Kings
Stroke: Medicare Population County: Kings
5.0%
(2022)
Compared to:
CA Counties
The distribution is based on data from 58 California counties.
U.S. Counties
The distribution is based on data from 3,129 U.S. counties and county equivalents.
CA Value
(5.0%)
The regional value is compared to the California state value.
US Value
(6.0%)
The regional value is compared to the national value.
Prior Value
(5.0%)
Prior Value compares a measured value with the previously measured value. Confidence intervals were not taken into account in determining the direction of the comparison.
Trend
This comparison measures the indicator’s values over multiple time periods.<br>The Mann-Kendall Test for Statistical Significance is used to evaluate the trend<br>over 4 to 10 periods of measure, subject to data availability and comparability.
Health / Immunizations & Infectious Diseases
Health / Immunizations & Infectious Diseases
Age-Adjusted Death Rate due to Influenza and Pneumonia
Value
Compared to:
Age-Adjusted Death Rate due to Influenza and Pneumonia County: Kings
Age-Adjusted Death Rate due to Influenza and Pneumonia County: Kings
12.6
Deaths per 100,000 population
(2019-2021)
Compared to:
CA Counties
The distribution is based on data from 57 California counties.
CA Value
(11.5)
The regional value is compared to the California state value.
US Value
(13.0 in 2020)
The regional value is compared to the national value. The source for the national value is Centers for Disease Control and Prevention
Prior Value
(12.9)
Prior Value compares a measured value with the previously measured value. Confidence intervals were taken into account in determining the direction of the comparison.
Trend
This comparison measures the indicator’s values over multiple time periods.<br>The Mann-Kendall Test for Statistical Significance is used to evaluate the trend<br>over 4 to 10 periods of measure, subject to data availability and comparability.
Health / Immunizations & Infectious Diseases
COVID-19 Daily Average Case-Fatality Rate
Value
Compared to:
COVID-19 Daily Average Case-Fatality Rate County: Kings
COVID-19 Daily Average Case-Fatality Rate County: Kings
5.1
Deaths per 100 cases
(Mar 3, 2023)
Compared to:
CA Counties
(Feb 3, 2023)
The distribution is based on data from 56 California counties.
U.S. Counties
(Mar 25, 2022)
The distribution is based on data from 2,811 U.S. counties and county equivalents.
CA Value
(1.0)
The regional value is compared to the California state value.
US Value
(1.7)
The regional value is compared to the national value.
Prior Value
(6.0)
Prior Value compares a measured value with the previously measured value. Confidence intervals were not taken into account in determining the direction of the comparison.
Trend
This comparison measures the indicator’s values over multiple time periods.<br>The Mann-Kendall Test for Statistical Significance is used to evaluate the trend<br>over 4 to 10 periods of measure, subject to data availability and comparability.
Health / Immunizations & Infectious Diseases
COVID-19 Daily Average Incidence Rate
Value
Compared to:
COVID-19 Daily Average Incidence Rate County: Kings
COVID-19 Daily Average Incidence Rate County: Kings
5.50
Cases per 100,000 population
(Mar 3, 2023)
Compared to:
CA Counties
The distribution is based on data from 58 California counties.
U.S. Counties
The distribution is based on data from 3,142 U.S. counties and county equivalents.
CA Value
(6.23)
The regional value is compared to the California state value.
US Value
(10.97)
The regional value is compared to the national value.
Prior Value
(7.84)
Prior Value compares a measured value with the previously measured value. Confidence intervals were not taken into account in determining the direction of the comparison.
Trend
This comparison measures the indicator’s values over multiple time periods.<br>The Mann-Kendall Test for Statistical Significance is used to evaluate the trend<br>over 4 to 10 periods of measure, subject to data availability and comparability.
Health / Immunizations & Infectious Diseases
Flu Vaccinations: Medicare Population
Value
Compared to:
Flu Vaccinations: Medicare Population County: Kings
Flu Vaccinations: Medicare Population County: Kings
37.0%
(2022)
Compared to:
CA Counties
The distribution is based on data from 58 California counties.
U.S. Counties
The distribution is based on data from 3,129 U.S. counties and county equivalents.
CA Value
(48.0%)
The regional value is compared to the California state value.
US Value
(50.0%)
The regional value is compared to the national value.
Prior Value
(37.0%)
Prior Value compares a measured value with the previously measured value. Confidence intervals were not taken into account in determining the direction of the comparison.
Trend
This comparison measures the indicator’s values over multiple time periods.<br>The Mann-Kendall Test for Statistical Significance is used to evaluate the trend<br>over 4 to 10 periods of measure, subject to data availability and comparability.
Health / Immunizations & Infectious Diseases
Kindergartners with Required Immunizations
Value
Compared to:
Kindergartners with Required Immunizations County: Kings
Kindergartners with Required Immunizations County: Kings
96.1%
(2021-2022)
Compared to:
CA Counties
The distribution is based on data from 56 California counties.
CA Value
(92.8%)
The regional value is compared to the California state value.
Prior Value
(97.8%)
Prior Value compares a measured value with the previously measured value. Confidence intervals were not taken into account in determining the direction of the comparison.
Trend
This comparison measures the indicator’s values over multiple time periods.<br>The Mann-Kendall Test for Statistical Significance is used to evaluate the trend<br>over 4 to 10 periods of measure, subject to data availability and comparability.
Overcrowded Households County: Kings
Overcrowded Households County: Kings
8.3%
(2018-2022)
Compared to:
CA Counties
The distribution is based on data from 58 California counties.
CA Value
(8.2%)
The regional value is compared to the California state value.
US Value
(3.4%)
The regional value is compared to the national value.
Trend
This comparison measures the indicator’s values over multiple time periods.<br>The Mann-Kendall Test for Statistical Significance is used to evaluate the trend<br>over 4 to 10 periods of measure, subject to data availability and comparability.
Health / Immunizations & Infectious Diseases
Persons Fully Vaccinated Against COVID-19
Value
Compared to:
Persons Fully Vaccinated Against COVID-19 County: Kings
Persons Fully Vaccinated Against COVID-19 County: Kings
52.7%
(May 10, 2023)
Compared to:
CA Counties
The distribution is based on data from 50 California counties.
U.S. Counties
The distribution is based on data from 3,125 U.S. counties and county equivalents.
Prior Value
(52.6%)
Prior Value compares a measured value with the previously measured value. Confidence intervals were not taken into account in determining the direction of the comparison.
Trend
This comparison measures the indicator’s values over multiple time periods.<br>The Mann-Kendall Test for Statistical Significance is used to evaluate the trend<br>over 4 to 10 periods of measure, subject to data availability and comparability.
Health / Immunizations & Infectious Diseases
Pneumonia Vaccinations: Medicare Population
Value
Compared to:
Pneumonia Vaccinations: Medicare Population County: Kings
Pneumonia Vaccinations: Medicare Population County: Kings
6.0%
(2022)
Compared to:
CA Counties
The distribution is based on data from 58 California counties.
U.S. Counties
The distribution is based on data from 3,129 U.S. counties and county equivalents.
CA Value
(8.0%)
The regional value is compared to the California state value.
US Value
(8.0%)
The regional value is compared to the national value.
Prior Value
(5.0%)
Prior Value compares a measured value with the previously measured value. Confidence intervals were not taken into account in determining the direction of the comparison.
Trend
This comparison measures the indicator’s values over multiple time periods.<br>The Mann-Kendall Test for Statistical Significance is used to evaluate the trend<br>over 4 to 10 periods of measure, subject to data availability and comparability.
Health / Immunizations & Infectious Diseases
Respondents who stated COVID-19 testing services are not accessible in the community
Value
Compared to:
Respondents who stated COVID-19 testing services are not accessible in the community County: Kings
Respondents who stated COVID-19 testing services are not accessible in the community County: Kings
4.4%
(2023)
Compared to:
No Comparison Data Available
(0%)
Health / Immunizations & Infectious Diseases
Respondents who stated COVID-19 vaccine services are not accessible in the community
Value
Compared to:
Respondents who stated COVID-19 vaccine services are not accessible in the community County: Kings
Respondents who stated COVID-19 vaccine services are not accessible in the community County: Kings
3.5%
(2023)
Compared to:
No Comparison Data Available
(0%)
Tuberculosis Incidence Rate County: Kings
Tuberculosis Incidence Rate County: Kings
5.2
Cases per 100,000 population
(2020)
Compared to:
CA Counties
(2019)
The distribution is based on data from 31 California counties.
CA Value
(4.3)
The regional value is compared to the California state value.
US Value
(2.2)
The regional value is compared to the national value. The source for the national value is Centers for Disease Control and Prevention
Prior Value
(3.3)
Prior Value compares a measured value with the previously measured value. Confidence intervals were not taken into account in determining the direction of the comparison.
Trend
This comparison measures the indicator’s values over multiple time periods.<br>The Mann-Kendall Test for Statistical Significance is used to evaluate the trend<br>over 4 to 10 periods of measure, subject to data availability and comparability.
HP 2030 Target
(1.4)
Health / Maternal, Fetal & Infant Health
Any In-Hospital Breastfeeding County: Kings
Any In-Hospital Breastfeeding County: Kings
89.7%
(2022)
Compared to:
CA Counties
The distribution is based on data from 58 California counties.
CA Value
(93.8%)
The regional value is compared to the California state value.
Prior Value
(90.6%)
Prior Value compares a measured value with the previously measured value. Confidence intervals were taken into account in determining the direction of the comparison.
Trend
This comparison measures the indicator’s values over multiple time periods.<br>The Mann-Kendall Test for Statistical Significance is used to evaluate the trend<br>over 4 to 10 periods of measure, subject to data availability and comparability.
Babies with Low Birthweight County: Kings
Babies with Low Birthweight County: Kings
6.6%
(2019-2021)
Compared to:
CA Counties
The distribution is based on data from 56 California counties.
CA Value
(7.1%)
The regional value is compared to the California state value.
US Value
(8.5% in 2021)
The regional value is compared to the national value. The source for the national value is Centers for Disease Control and Prevention
Prior Value
(6.4%)
Prior Value compares a measured value with the previously measured value. Confidence intervals were taken into account in determining the direction of the comparison.
Trend
This comparison measures the indicator’s values over multiple time periods.<br>The Mann-Kendall Test for Statistical Significance is used to evaluate the trend<br>over 4 to 10 periods of measure, subject to data availability and comparability.
In-Hospital Exclusive Breastfeeding County: Kings
In-Hospital Exclusive Breastfeeding County: Kings
60.7%
(2022)
Compared to:
CA Counties
The distribution is based on data from 58 California counties.
CA Value
(68.5%)
The regional value is compared to the California state value.
Prior Value
(57.0%)
Prior Value compares a measured value with the previously measured value. Confidence intervals were taken into account in determining the direction of the comparison.
Trend
This comparison measures the indicator’s values over multiple time periods.<br>The Mann-Kendall Test for Statistical Significance is used to evaluate the trend<br>over 4 to 10 periods of measure, subject to data availability and comparability.
Infant Mortality Rate County: Kings
Infant Mortality Rate County: Kings
4.1
Deaths per 1,000 live births
(2017-2019)
Compared to:
CA Value
(3.9)
The regional value is compared to the California state value.
US Value
(5.7)
The regional value is compared to the national value. The source for the national value is Centers for Disease Control and Prevention
Prior Value
(4.2)
Prior Value compares a measured value with the previously measured value. Confidence intervals were taken into account in determining the direction of the comparison.
Trend
This comparison measures the indicator’s values over multiple time periods.<br>The Mann-Kendall Test for Statistical Significance is used to evaluate the trend<br>over 4 to 10 periods of measure, subject to data availability and comparability.
HP 2030 Target
(5.0)
<div>MICH-02: Reduce the rate of infant deaths <strong>(LEADING HEALTH INDICATOR)</strong></div>
Mothers who Breastfeed County: Kings
Mothers who Breastfeed County: Kings
89.1%
(2018-2020)
Compared to:
CA Counties
The distribution is based on data from 58 California counties.
CA Value
(93.8%)
The regional value is compared to the California state value.
Prior Value
(89.8%)
Prior Value compares a measured value with the previously measured value. Confidence intervals were taken into account in determining the direction of the comparison.
Trend
This comparison measures the indicator’s values over multiple time periods.<br>The Mann-Kendall Test for Statistical Significance is used to evaluate the trend<br>over 4 to 10 periods of measure, subject to data availability and comparability.
Health / Maternal, Fetal & Infant Health
Mothers who Received Early Prenatal Care
Value
Compared to:
Mothers who Received Early Prenatal Care County: Kings
Mothers who Received Early Prenatal Care County: Kings
88.3%
(2019-2021)
Compared to:
CA Counties
The distribution is based on data from 58 California counties.
CA Value
(87.9%)
The regional value is compared to the California state value.
US Value
(78.3% in 2021)
The regional value is compared to the national value. The source for the national value is Centers for Disease Control and Prevention
Prior Value
(84.1%)
Prior Value compares a measured value with the previously measured value. Confidence intervals were taken into account in determining the direction of the comparison.
Trend
This comparison measures the indicator’s values over multiple time periods.<br>The Mann-Kendall Test for Statistical Significance is used to evaluate the trend<br>over 4 to 10 periods of measure, subject to data availability and comparability.
Preterm Births County: Kings
Preterm Births County: Kings
9.5%
(2020-2022)
Compared to:
CA Counties
The distribution is based on data from 58 California counties.
CA Value
(9.0%)
The regional value is compared to the California state value.
Prior Value
(9.3%)
Prior Value compares a measured value with the previously measured value. Confidence intervals were taken into account in determining the direction of the comparison.
Trend
This comparison measures the indicator’s values over multiple time periods.<br>The Mann-Kendall Test for Statistical Significance is used to evaluate the trend<br>over 4 to 10 periods of measure, subject to data availability and comparability.
HP 2030 Target
(9.4%)
Teen Birth Rate: 15-19 County: Kings
Teen Birth Rate: 15-19 County: Kings
18.8
Live births per 1,000 females aged 15-19
(2019-2021)
Compared to:
CA Counties
The distribution is based on data from 55 California counties.
CA Value
(10.3)
The regional value is compared to the California state value.
US Value
(15.2)
The regional value is compared to the national value. The source for the national value is Centers for Disease Control and Prevention, National Center for Health Statistics
Prior Value
(20.4)
Prior Value compares a measured value with the previously measured value. Confidence intervals were taken into account in determining the direction of the comparison.
Trend
This comparison measures the indicator’s values over multiple time periods.<br>The Mann-Kendall Test for Statistical Significance is used to evaluate the trend<br>over 4 to 10 periods of measure, subject to data availability and comparability.
Health / Medications & Prescriptions
Health / Medications & Prescriptions
Adults who Bought Medications for Anxiety or Depression
Value
Compared to:
Adults who Bought Medications for Anxiety or Depression County: Kings
Adults who Bought Medications for Anxiety or Depression County: Kings
16.1%
(2023)
Compared to:
CA Value
(13.7%)
The regional value is compared to the California state value.
US Value
(14.9%)
The regional value is compared to the national value.
Prior Value
(16.0%)
Prior Value compares a measured value with the previously measured value. Confidence intervals were not taken into account in determining the direction of the comparison.
Health / Medications & Prescriptions
Adults Who Bought Medications to Quit Smoking
Value
Compared to:
Adults Who Bought Medications to Quit Smoking County: Kings
Adults Who Bought Medications to Quit Smoking County: Kings
1.5%
(2023)
Compared to:
CA Value
(1.2%)
The regional value is compared to the California state value.
US Value
(1.4%)
The regional value is compared to the national value.
Prior Value
(1.6%)
Prior Value compares a measured value with the previously measured value. Confidence intervals were not taken into account in determining the direction of the comparison.
Trend
This comparison measures the indicator’s values over multiple time periods.<br>The Mann-Kendall Test for Statistical Significance is used to evaluate the trend<br>over 4 to 10 periods of measure, subject to data availability and comparability.
