
Search for Indicators
Maternal Wellness
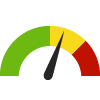
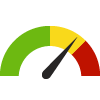
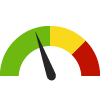
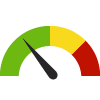
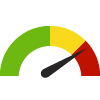
Indicator Gauge Icon Legend
Legend Colors
Red is bad, green is good, blue is not statistically different/neutral.
Compared to Distribution
 the value is in the best half of communities.
 the value is in the 2nd worst quarter of communities.
 the value is in the worst quarter of communities.
Compared to Target
 meets target;
  does not meet target.
Compared to a Single Value
 lower than the comparison value;
 higher than the comparison value;
 not statistically different from comparison value.
Trend

 non-significant change over time;
 significant change over time;
  no change over time.
Compared to Prior Value
 higher than the previous measurement period;
 lower than the previous measurement period;
 no statistically different change from previous measurement period.
Health / Maternal, Fetal & Infant Health
Adults Who Visited an OB/GYN County: Kings
Adults Who Visited an OB/GYN County: Kings
15.3%
(2023)
Compared to:


CA Value
(16.6%)
The regional value is compared to the California state value.
US Value
(15.7%)
The regional value is compared to the national value.
Prior Value
(16.1%)
Prior Value compares a measured value with the previously measured value. Confidence intervals were not taken into account in determining the direction of the comparison.
Trend
This comparison measures the indicator’s values over multiple time periods.<br>The Mann-Kendall Test for Statistical Significance is used to evaluate the trend<br>over 4 to 10 periods of measure, subject to data availability and comparability.
Adults Who Visited an OB/GYN Census Place: Armona
Adults Who Visited an OB/GYN Census Place: Armona
16.5%
(2023)
Compared to:

Kings, CA County Value
(15.3%)
The regional value is compared to the Kings County value.
CA Value
(16.6%)
The regional value is compared to the California state value.
US Value
(15.7%)
The regional value is compared to the national value.
Prior Value
(17.0%)
Prior Value compares a measured value with the previously measured value. Confidence intervals were not taken into account in determining the direction of the comparison.
Trend
This comparison measures the indicator’s values over multiple time periods.<br>The Mann-Kendall Test for Statistical Significance is used to evaluate the trend<br>over 4 to 10 periods of measure, subject to data availability and comparability.
Adults Who Visited an OB/GYN Census Place: Avenal
Adults Who Visited an OB/GYN Census Place: Avenal
15.6%
(2023)
Compared to:
Kings, CA County Value
(15.3%)
The regional value is compared to the Kings County value.
CA Value
(16.6%)
The regional value is compared to the California state value.
US Value
(15.7%)
The regional value is compared to the national value.
Prior Value
(16.3%)
Prior Value compares a measured value with the previously measured value. Confidence intervals were not taken into account in determining the direction of the comparison.
Trend
This comparison measures the indicator’s values over multiple time periods.<br>The Mann-Kendall Test for Statistical Significance is used to evaluate the trend<br>over 4 to 10 periods of measure, subject to data availability and comparability.
Adults Who Visited an OB/GYN Census Place: Corcoran
Adults Who Visited an OB/GYN Census Place: Corcoran
13.6%
(2023)
Compared to:

Kings, CA County Value
(15.3%)
The regional value is compared to the Kings County value.
CA Value
(16.6%)
The regional value is compared to the California state value.
US Value
(15.7%)
The regional value is compared to the national value.
Prior Value
(14.9%)
Prior Value compares a measured value with the previously measured value. Confidence intervals were not taken into account in determining the direction of the comparison.
Trend
This comparison measures the indicator’s values over multiple time periods.<br>The Mann-Kendall Test for Statistical Significance is used to evaluate the trend<br>over 4 to 10 periods of measure, subject to data availability and comparability.
Adults Who Visited an OB/GYN Census Place: Grangeville
Adults Who Visited an OB/GYN Census Place: Grangeville
17.0%
(2023)
Compared to:

Kings, CA County Value
(15.3%)
The regional value is compared to the Kings County value.
CA Value
(16.6%)
The regional value is compared to the California state value.
US Value
(15.7%)
The regional value is compared to the national value.
Prior Value
(16.1%)
Prior Value compares a measured value with the previously measured value. Confidence intervals were not taken into account in determining the direction of the comparison.
Trend
This comparison measures the indicator’s values over multiple time periods.<br>The Mann-Kendall Test for Statistical Significance is used to evaluate the trend<br>over 4 to 10 periods of measure, subject to data availability and comparability.
Adults Who Visited an OB/GYN Census Place: Hanford
Adults Who Visited an OB/GYN Census Place: Hanford
15.3%
(2023)
Compared to:
Kings, CA County Value
(15.3%)
The regional value is compared to the Kings County value.
CA Value
(16.6%)
The regional value is compared to the California state value.
US Value
(15.7%)
The regional value is compared to the national value.
Prior Value
(16.1%)
Prior Value compares a measured value with the previously measured value. Confidence intervals were not taken into account in determining the direction of the comparison.
Trend
This comparison measures the indicator’s values over multiple time periods.<br>The Mann-Kendall Test for Statistical Significance is used to evaluate the trend<br>over 4 to 10 periods of measure, subject to data availability and comparability.
Adults Who Visited an OB/GYN Census Place: Hardwick
Adults Who Visited an OB/GYN Census Place: Hardwick
13.9%
(2023)
Compared to:
Kings, CA County Value
(15.3%)
The regional value is compared to the Kings County value.
CA Value
(16.6%)
The regional value is compared to the California state value.
US Value
(15.7%)
The regional value is compared to the national value.
Prior Value
(14.9%)
Prior Value compares a measured value with the previously measured value. Confidence intervals were not taken into account in determining the direction of the comparison.
Trend
This comparison measures the indicator’s values over multiple time periods.<br>The Mann-Kendall Test for Statistical Significance is used to evaluate the trend<br>over 4 to 10 periods of measure, subject to data availability and comparability.
Adults Who Visited an OB/GYN Census Place: Home Garden
Adults Who Visited an OB/GYN Census Place: Home Garden
14.7%
(2023)
Compared to:
Kings, CA County Value
(15.3%)
The regional value is compared to the Kings County value.
CA Value
(16.6%)
The regional value is compared to the California state value.
US Value
(15.7%)
The regional value is compared to the national value.
Prior Value
(15.2%)
Prior Value compares a measured value with the previously measured value. Confidence intervals were not taken into account in determining the direction of the comparison.
Trend
This comparison measures the indicator’s values over multiple time periods.<br>The Mann-Kendall Test for Statistical Significance is used to evaluate the trend<br>over 4 to 10 periods of measure, subject to data availability and comparability.
Adults Who Visited an OB/GYN Census Place: Kettleman City
Adults Who Visited an OB/GYN Census Place: Kettleman City
12.7%
(2023)
Compared to:
Kings, CA County Value
(15.3%)
The regional value is compared to the Kings County value.
CA Value
(16.6%)
The regional value is compared to the California state value.
US Value
(15.7%)
The regional value is compared to the national value.
Prior Value
(14.1%)
Prior Value compares a measured value with the previously measured value. Confidence intervals were not taken into account in determining the direction of the comparison.
Trend
This comparison measures the indicator’s values over multiple time periods.<br>The Mann-Kendall Test for Statistical Significance is used to evaluate the trend<br>over 4 to 10 periods of measure, subject to data availability and comparability.
Adults Who Visited an OB/GYN Census Place: Lemoore
Adults Who Visited an OB/GYN Census Place: Lemoore
16.2%
(2023)
Compared to:
Kings, CA County Value
(15.3%)
The regional value is compared to the Kings County value.
CA Value
(16.6%)
The regional value is compared to the California state value.
US Value
(15.7%)
The regional value is compared to the national value.
Prior Value
(17.4%)
Prior Value compares a measured value with the previously measured value. Confidence intervals were not taken into account in determining the direction of the comparison.
Trend
This comparison measures the indicator’s values over multiple time periods.<br>The Mann-Kendall Test for Statistical Significance is used to evaluate the trend<br>over 4 to 10 periods of measure, subject to data availability and comparability.
Adults Who Visited an OB/GYN Census Place: Lemoore Station
Adults Who Visited an OB/GYN Census Place: Lemoore Station
15.4%
(2023)
Compared to:
Kings, CA County Value
(15.3%)
The regional value is compared to the Kings County value.
CA Value
(16.6%)
The regional value is compared to the California state value.
US Value
(15.7%)
The regional value is compared to the national value.
Prior Value
(16.4%)
Prior Value compares a measured value with the previously measured value. Confidence intervals were not taken into account in determining the direction of the comparison.
Trend
This comparison measures the indicator’s values over multiple time periods.<br>The Mann-Kendall Test for Statistical Significance is used to evaluate the trend<br>over 4 to 10 periods of measure, subject to data availability and comparability.
Adults Who Visited an OB/GYN Census Place: Stratford
Adults Who Visited an OB/GYN Census Place: Stratford
14.3%
(2023)
Compared to:
Kings, CA County Value
(15.3%)
The regional value is compared to the Kings County value.
CA Value
(16.6%)
The regional value is compared to the California state value.
US Value
(15.7%)
The regional value is compared to the national value.
Prior Value
(13.6%)
Prior Value compares a measured value with the previously measured value. Confidence intervals were not taken into account in determining the direction of the comparison.
Trend
This comparison measures the indicator’s values over multiple time periods.<br>The Mann-Kendall Test for Statistical Significance is used to evaluate the trend<br>over 4 to 10 periods of measure, subject to data availability and comparability.
Adults Who Visited an OB/GYN Zip Code: 93202
Adults Who Visited an OB/GYN Zip Code: 93202
16.6%
(2023)
Compared to:
Kings, CA County Value
(15.3%)
The regional value is compared to the Kings County value.
Prior Value
(17.1%)
Prior Value compares a measured value with the previously measured value. Confidence intervals were not taken into account in determining the direction of the comparison.
Trend
This comparison measures the indicator’s values over multiple time periods.<br>The Mann-Kendall Test for Statistical Significance is used to evaluate the trend<br>over 4 to 10 periods of measure, subject to data availability and comparability.
Adults Who Visited an OB/GYN Zip Code: 93204
Adults Who Visited an OB/GYN Zip Code: 93204
15.5%
(2023)
Compared to:
Kings, CA County Value
(15.3%)
The regional value is compared to the Kings County value.
Prior Value
(16.2%)
Prior Value compares a measured value with the previously measured value. Confidence intervals were not taken into account in determining the direction of the comparison.
Trend
This comparison measures the indicator’s values over multiple time periods.<br>The Mann-Kendall Test for Statistical Significance is used to evaluate the trend<br>over 4 to 10 periods of measure, subject to data availability and comparability.
Adults Who Visited an OB/GYN Zip Code: 93212
Adults Who Visited an OB/GYN Zip Code: 93212
13.6%
(2023)
Compared to:
Kings, CA County Value
(15.3%)
The regional value is compared to the Kings County value.
Prior Value
(14.9%)
Prior Value compares a measured value with the previously measured value. Confidence intervals were not taken into account in determining the direction of the comparison.
Trend
This comparison measures the indicator’s values over multiple time periods.<br>The Mann-Kendall Test for Statistical Significance is used to evaluate the trend<br>over 4 to 10 periods of measure, subject to data availability and comparability.
Adults Who Visited an OB/GYN Zip Code: 93230
Adults Who Visited an OB/GYN Zip Code: 93230
15.2%
(2023)
Compared to:
Kings, CA County Value
(15.3%)
The regional value is compared to the Kings County value.
Prior Value
(15.9%)
Prior Value compares a measured value with the previously measured value. Confidence intervals were not taken into account in determining the direction of the comparison.
Trend
This comparison measures the indicator’s values over multiple time periods.<br>The Mann-Kendall Test for Statistical Significance is used to evaluate the trend<br>over 4 to 10 periods of measure, subject to data availability and comparability.
Adults Who Visited an OB/GYN Zip Code: 93239
Adults Who Visited an OB/GYN Zip Code: 93239
12.7%
(2023)
Compared to:
Kings, CA County Value
(15.3%)
The regional value is compared to the Kings County value.
Prior Value
(14.1%)
Prior Value compares a measured value with the previously measured value. Confidence intervals were not taken into account in determining the direction of the comparison.
Trend
This comparison measures the indicator’s values over multiple time periods.<br>The Mann-Kendall Test for Statistical Significance is used to evaluate the trend<br>over 4 to 10 periods of measure, subject to data availability and comparability.
Adults Who Visited an OB/GYN Zip Code: 93245
Adults Who Visited an OB/GYN Zip Code: 93245
16.1%
(2023)
Compared to:
Kings, CA County Value
(15.3%)
The regional value is compared to the Kings County value.
Prior Value
(17.0%)
Prior Value compares a measured value with the previously measured value. Confidence intervals were not taken into account in determining the direction of the comparison.
Trend
This comparison measures the indicator’s values over multiple time periods.<br>The Mann-Kendall Test for Statistical Significance is used to evaluate the trend<br>over 4 to 10 periods of measure, subject to data availability and comparability.
Adults Who Visited an OB/GYN Zip Code: 93246
Adults Who Visited an OB/GYN Zip Code: 93246
15.4%
(2023)
Compared to:
Kings, CA County Value
(15.3%)
The regional value is compared to the Kings County value.
Prior Value
(17.1%)
Prior Value compares a measured value with the previously measured value. Confidence intervals were not taken into account in determining the direction of the comparison.
Adults Who Visited an OB/GYN Zip Code: 93266
Adults Who Visited an OB/GYN Zip Code: 93266
14.2%
(2023)
Compared to:
Kings, CA County Value
(15.3%)
The regional value is compared to the Kings County value.
Prior Value
(13.8%)
Prior Value compares a measured value with the previously measured value. Confidence intervals were not taken into account in determining the direction of the comparison.
Trend
This comparison measures the indicator’s values over multiple time periods.<br>The Mann-Kendall Test for Statistical Significance is used to evaluate the trend<br>over 4 to 10 periods of measure, subject to data availability and comparability.
Adults Who Visited an OB/GYN Census Tract: 06031000100
Adults Who Visited an OB/GYN Census Tract: 06031000100
14.4%
(2023)
Compared to:
Kings, CA County Value
(15.3%)
The regional value is compared to the Kings County value.
Prior Value
(14.7%)
Prior Value compares a measured value with the previously measured value. Confidence intervals were not taken into account in determining the direction of the comparison.
Trend
This comparison measures the indicator’s values over multiple time periods.<br>The Mann-Kendall Test for Statistical Significance is used to evaluate the trend<br>over 4 to 10 periods of measure, subject to data availability and comparability.
Adults Who Visited an OB/GYN Census Tract: 06031000200
Adults Who Visited an OB/GYN Census Tract: 06031000200
14.7%
(2023)
Compared to:
Kings, CA County Value
(15.3%)
The regional value is compared to the Kings County value.
Prior Value
(14.3%)
Prior Value compares a measured value with the previously measured value. Confidence intervals were not taken into account in determining the direction of the comparison.
Trend
This comparison measures the indicator’s values over multiple time periods.<br>The Mann-Kendall Test for Statistical Significance is used to evaluate the trend<br>over 4 to 10 periods of measure, subject to data availability and comparability.
Adults Who Visited an OB/GYN Census Tract: 06031000300
Adults Who Visited an OB/GYN Census Tract: 06031000300
16.4%
(2022)
Compared to:
Kings, CA County Value
(16.1%)
The regional value is compared to the Kings County value.
Prior Value
(21.1%)
Prior Value compares a measured value with the previously measured value. Confidence intervals were not taken into account in determining the direction of the comparison.
Adults Who Visited an OB/GYN Census Tract: 06031000402
Adults Who Visited an OB/GYN Census Tract: 06031000402
18.5%
(2023)
Compared to:
Kings, CA County Value
(15.3%)
The regional value is compared to the Kings County value.
Prior Value
(17.3%)
Prior Value compares a measured value with the previously measured value. Confidence intervals were not taken into account in determining the direction of the comparison.
Trend
This comparison measures the indicator’s values over multiple time periods.<br>The Mann-Kendall Test for Statistical Significance is used to evaluate the trend<br>over 4 to 10 periods of measure, subject to data availability and comparability.
Adults Who Visited an OB/GYN Census Tract: 06031000403
Adults Who Visited an OB/GYN Census Tract: 06031000403
15.4%
(2023)
Compared to:
Kings, CA County Value
(15.3%)
The regional value is compared to the Kings County value.
Prior Value
(17.1%)
Prior Value compares a measured value with the previously measured value. Confidence intervals were not taken into account in determining the direction of the comparison.
Trend
This comparison measures the indicator’s values over multiple time periods.<br>The Mann-Kendall Test for Statistical Significance is used to evaluate the trend<br>over 4 to 10 periods of measure, subject to data availability and comparability.
Adults Who Visited an OB/GYN Census Tract: 06031000404
Adults Who Visited an OB/GYN Census Tract: 06031000404
17.6%
(2022)
Compared to:
Kings, CA County Value
(16.1%)
The regional value is compared to the Kings County value.
Prior Value
(18.3%)
Prior Value compares a measured value with the previously measured value. Confidence intervals were not taken into account in determining the direction of the comparison.
Adults Who Visited an OB/GYN Census Tract: 06031000405
Adults Who Visited an OB/GYN Census Tract: 06031000405
15.2%
(2023)
Compared to:
Kings, CA County Value
(15.3%)
The regional value is compared to the Kings County value.
Prior Value
(17.2%)
Prior Value compares a measured value with the previously measured value. Confidence intervals were not taken into account in determining the direction of the comparison.
Trend
This comparison measures the indicator’s values over multiple time periods.<br>The Mann-Kendall Test for Statistical Significance is used to evaluate the trend<br>over 4 to 10 periods of measure, subject to data availability and comparability.
Adults Who Visited an OB/GYN Census Tract: 06031000406
Adults Who Visited an OB/GYN Census Tract: 06031000406
17.2%
(2023)
Compared to:
Kings, CA County Value
(15.3%)
The regional value is compared to the Kings County value.
Adults Who Visited an OB/GYN Census Tract: 06031000407
Adults Who Visited an OB/GYN Census Tract: 06031000407
16.1%
(2023)
Compared to:
Kings, CA County Value
(15.3%)
The regional value is compared to the Kings County value.
Adults Who Visited an OB/GYN Census Tract: 06031000500
Adults Who Visited an OB/GYN Census Tract: 06031000500
16.6%
(2023)
Compared to:
Kings, CA County Value
(15.3%)
The regional value is compared to the Kings County value.
Prior Value
(16.9%)
Prior Value compares a measured value with the previously measured value. Confidence intervals were not taken into account in determining the direction of the comparison.
Trend
This comparison measures the indicator’s values over multiple time periods.<br>The Mann-Kendall Test for Statistical Significance is used to evaluate the trend<br>over 4 to 10 periods of measure, subject to data availability and comparability.
Adults Who Visited an OB/GYN Census Tract: 06031000601
Adults Who Visited an OB/GYN Census Tract: 06031000601
17.2%
(2022)
Compared to:
Kings, CA County Value
(16.1%)
The regional value is compared to the Kings County value.
Prior Value
(20.4%)
Prior Value compares a measured value with the previously measured value. Confidence intervals were not taken into account in determining the direction of the comparison.
Adults Who Visited an OB/GYN Census Tract: 06031000602
Adults Who Visited an OB/GYN Census Tract: 06031000602
15.7%
(2023)
Compared to:
Kings, CA County Value
(15.3%)
The regional value is compared to the Kings County value.
Prior Value
(15.9%)
Prior Value compares a measured value with the previously measured value. Confidence intervals were not taken into account in determining the direction of the comparison.
Trend
This comparison measures the indicator’s values over multiple time periods.<br>The Mann-Kendall Test for Statistical Significance is used to evaluate the trend<br>over 4 to 10 periods of measure, subject to data availability and comparability.
Adults Who Visited an OB/GYN Census Tract: 06031000603
Adults Who Visited an OB/GYN Census Tract: 06031000603
20.4%
(2023)
Compared to:
Kings, CA County Value
(15.3%)
The regional value is compared to the Kings County value.
Adults Who Visited an OB/GYN Census Tract: 06031000604
Adults Who Visited an OB/GYN Census Tract: 06031000604
18.6%
(2023)
Compared to:
Kings, CA County Value
(15.3%)
The regional value is compared to the Kings County value.
Adults Who Visited an OB/GYN Census Tract: 06031000701
Adults Who Visited an OB/GYN Census Tract: 06031000701
15.6%
(2023)
Compared to:
Kings, CA County Value
(15.3%)
The regional value is compared to the Kings County value.
Prior Value
(15.8%)
Prior Value compares a measured value with the previously measured value. Confidence intervals were not taken into account in determining the direction of the comparison.
Trend
This comparison measures the indicator’s values over multiple time periods.<br>The Mann-Kendall Test for Statistical Significance is used to evaluate the trend<br>over 4 to 10 periods of measure, subject to data availability and comparability.
Adults Who Visited an OB/GYN Census Tract: 06031000702
Adults Who Visited an OB/GYN Census Tract: 06031000702
14.8%
(2023)
Compared to:
Kings, CA County Value
(15.3%)
The regional value is compared to the Kings County value.
Prior Value
(16.0%)
Prior Value compares a measured value with the previously measured value. Confidence intervals were not taken into account in determining the direction of the comparison.
Trend
This comparison measures the indicator’s values over multiple time periods.<br>The Mann-Kendall Test for Statistical Significance is used to evaluate the trend<br>over 4 to 10 periods of measure, subject to data availability and comparability.
Adults Who Visited an OB/GYN Census Tract: 06031000800
Adults Who Visited an OB/GYN Census Tract: 06031000800
14.2%
(2023)
Compared to:
Kings, CA County Value
(15.3%)
The regional value is compared to the Kings County value.
Prior Value
(15.3%)
Prior Value compares a measured value with the previously measured value. Confidence intervals were not taken into account in determining the direction of the comparison.
Trend
This comparison measures the indicator’s values over multiple time periods.<br>The Mann-Kendall Test for Statistical Significance is used to evaluate the trend<br>over 4 to 10 periods of measure, subject to data availability and comparability.
Adults Who Visited an OB/GYN Census Tract: 06031000900
Adults Who Visited an OB/GYN Census Tract: 06031000900
16.1%
(2022)
Compared to:
Kings, CA County Value
(16.1%)
The regional value is compared to the Kings County value.
Prior Value
(18.5%)
Prior Value compares a measured value with the previously measured value. Confidence intervals were not taken into account in determining the direction of the comparison.
Adults Who Visited an OB/GYN Census Tract: 06031000901
Adults Who Visited an OB/GYN Census Tract: 06031000901
13.9%
(2023)
Compared to:
Kings, CA County Value
(15.3%)
The regional value is compared to the Kings County value.
Adults Who Visited an OB/GYN Census Tract: 06031000902
Adults Who Visited an OB/GYN Census Tract: 06031000902
11.4%
(2023)
Compared to:
Kings, CA County Value
(15.3%)
The regional value is compared to the Kings County value.
Adults Who Visited an OB/GYN Census Tract: 06031001001
Adults Who Visited an OB/GYN Census Tract: 06031001001
17.0%
(2023)
Compared to:
Kings, CA County Value
(15.3%)
The regional value is compared to the Kings County value.
Prior Value
(16.5%)
Prior Value compares a measured value with the previously measured value. Confidence intervals were not taken into account in determining the direction of the comparison.
Trend
This comparison measures the indicator’s values over multiple time periods.<br>The Mann-Kendall Test for Statistical Significance is used to evaluate the trend<br>over 4 to 10 periods of measure, subject to data availability and comparability.
Adults Who Visited an OB/GYN Census Tract: 06031001002
Adults Who Visited an OB/GYN Census Tract: 06031001002
13.7%
(2023)
Compared to:
Kings, CA County Value
(15.3%)
The regional value is compared to the Kings County value.
Prior Value
(15.3%)
Prior Value compares a measured value with the previously measured value. Confidence intervals were not taken into account in determining the direction of the comparison.
Trend
This comparison measures the indicator’s values over multiple time periods.<br>The Mann-Kendall Test for Statistical Significance is used to evaluate the trend<br>over 4 to 10 periods of measure, subject to data availability and comparability.
Adults Who Visited an OB/GYN Census Tract: 06031001003
Adults Who Visited an OB/GYN Census Tract: 06031001003
15.4%
(2023)
Compared to:
Kings, CA County Value
(15.3%)
The regional value is compared to the Kings County value.
Prior Value
(16.5%)
Prior Value compares a measured value with the previously measured value. Confidence intervals were not taken into account in determining the direction of the comparison.
Trend
This comparison measures the indicator’s values over multiple time periods.<br>The Mann-Kendall Test for Statistical Significance is used to evaluate the trend<br>over 4 to 10 periods of measure, subject to data availability and comparability.
Adults Who Visited an OB/GYN Census Tract: 06031001100
Adults Who Visited an OB/GYN Census Tract: 06031001100
11.8%
(2023)
Compared to:
Kings, CA County Value
(15.3%)
The regional value is compared to the Kings County value.
Prior Value
(13.6%)
Prior Value compares a measured value with the previously measured value. Confidence intervals were not taken into account in determining the direction of the comparison.
Trend
This comparison measures the indicator’s values over multiple time periods.<br>The Mann-Kendall Test for Statistical Significance is used to evaluate the trend<br>over 4 to 10 periods of measure, subject to data availability and comparability.
Adults Who Visited an OB/GYN Census Tract: 06031001200
Adults Who Visited an OB/GYN Census Tract: 06031001200
13.5%
(2023)
Compared to:
Kings, CA County Value
(15.3%)
The regional value is compared to the Kings County value.
Prior Value
(14.4%)
Prior Value compares a measured value with the previously measured value. Confidence intervals were not taken into account in determining the direction of the comparison.
Trend
This comparison measures the indicator’s values over multiple time periods.<br>The Mann-Kendall Test for Statistical Significance is used to evaluate the trend<br>over 4 to 10 periods of measure, subject to data availability and comparability.
Adults Who Visited an OB/GYN Census Tract: 06031001300
Adults Who Visited an OB/GYN Census Tract: 06031001300
13.5%
(2023)
Compared to:
Kings, CA County Value
(15.3%)
The regional value is compared to the Kings County value.
Prior Value
(14.9%)
Prior Value compares a measured value with the previously measured value. Confidence intervals were not taken into account in determining the direction of the comparison.
Trend
This comparison measures the indicator’s values over multiple time periods.<br>The Mann-Kendall Test for Statistical Significance is used to evaluate the trend<br>over 4 to 10 periods of measure, subject to data availability and comparability.
Adults Who Visited an OB/GYN Census Tract: 06031001401
Adults Who Visited an OB/GYN Census Tract: 06031001401
14.4%
(2023)
Compared to:
Kings, CA County Value
(15.3%)
The regional value is compared to the Kings County value.
Prior Value
(15.5%)
Prior Value compares a measured value with the previously measured value. Confidence intervals were not taken into account in determining the direction of the comparison.
Trend
This comparison measures the indicator’s values over multiple time periods.<br>The Mann-Kendall Test for Statistical Significance is used to evaluate the trend<br>over 4 to 10 periods of measure, subject to data availability and comparability.
Adults Who Visited an OB/GYN Census Tract: 06031001402
Adults Who Visited an OB/GYN Census Tract: 06031001402
12.2%
(2023)
Compared to:
Kings, CA County Value
(15.3%)
The regional value is compared to the Kings County value.
Prior Value
(15.5%)
Prior Value compares a measured value with the previously measured value. Confidence intervals were not taken into account in determining the direction of the comparison.
Trend
This comparison measures the indicator’s values over multiple time periods.<br>The Mann-Kendall Test for Statistical Significance is used to evaluate the trend<br>over 4 to 10 periods of measure, subject to data availability and comparability.
Adults Who Visited an OB/GYN Census Tract: 06031001500
Adults Who Visited an OB/GYN Census Tract: 06031001500
14.1%
(2023)
Compared to:
Kings, CA County Value
(15.3%)
The regional value is compared to the Kings County value.
Prior Value
(14.5%)
Prior Value compares a measured value with the previously measured value. Confidence intervals were not taken into account in determining the direction of the comparison.
Trend
This comparison measures the indicator’s values over multiple time periods.<br>The Mann-Kendall Test for Statistical Significance is used to evaluate the trend<br>over 4 to 10 periods of measure, subject to data availability and comparability.
Adults Who Visited an OB/GYN Census Tract: 06031001601
Adults Who Visited an OB/GYN Census Tract: 06031001601
13.8%
(2023)
Compared to:
Kings, CA County Value
(15.3%)
The regional value is compared to the Kings County value.
Prior Value
(14.1%)
Prior Value compares a measured value with the previously measured value. Confidence intervals were not taken into account in determining the direction of the comparison.
Trend
This comparison measures the indicator’s values over multiple time periods.<br>The Mann-Kendall Test for Statistical Significance is used to evaluate the trend<br>over 4 to 10 periods of measure, subject to data availability and comparability.
Adults Who Visited an OB/GYN Census Tract: 06031001602
Adults Who Visited an OB/GYN Census Tract: 06031001602
0.0%
(2022)
Compared to:
Kings, CA County Value
(16.1%)
The regional value is compared to the Kings County value.
Prior Value
(0.0%)
Prior Value compares a measured value with the previously measured value. Confidence intervals were not taken into account in determining the direction of the comparison.
Adults Who Visited an OB/GYN Census Tract: 06031001701
Adults Who Visited an OB/GYN Census Tract: 06031001701
16.2%
(2022)
Compared to:
Kings, CA County Value
(16.1%)
The regional value is compared to the Kings County value.
Prior Value
(19.0%)
Prior Value compares a measured value with the previously measured value. Confidence intervals were not taken into account in determining the direction of the comparison.
Adults Who Visited an OB/GYN Census Tract: 06031001702
Adults Who Visited an OB/GYN Census Tract: 06031001702
16.5%
(2023)
Compared to:
Kings, CA County Value
(15.3%)
The regional value is compared to the Kings County value.
Adults Who Visited an OB/GYN Census Tract: 06031001703
Adults Who Visited an OB/GYN Census Tract: 06031001703
14.6%
(2023)
Compared to:
Kings, CA County Value
(15.3%)
The regional value is compared to the Kings County value.
Adults Who Visited an OB/GYN Census Tract: 06031980000
Adults Who Visited an OB/GYN Census Tract: 06031980000
15.4%
(2023)
Compared to:
Kings, CA County Value
(15.3%)
The regional value is compared to the Kings County value.
Adults Who Visited an OB/GYN Census Tract: 06031980100
Adults Who Visited an OB/GYN Census Tract: 06031980100
0.0%
(2023)
Compared to:
Kings, CA County Value
(15.3%)
The regional value is compared to the Kings County value.
Adults Who Visited an OB/GYN Census Tract: 06031981800
Adults Who Visited an OB/GYN Census Tract: 06031981800
0.0%
(2023)
Compared to:
Kings, CA County Value
(15.3%)
The regional value is compared to the Kings County value.
Prior Value
(0.0%)
Prior Value compares a measured value with the previously measured value. Confidence intervals were not taken into account in determining the direction of the comparison.
Trend
This comparison measures the indicator’s values over multiple time periods.<br>The Mann-Kendall Test for Statistical Significance is used to evaluate the trend<br>over 4 to 10 periods of measure, subject to data availability and comparability.
Any In-Hospital Breastfeeding County: Kings
Any In-Hospital Breastfeeding County: Kings
89.7%
(2022)
Compared to:

CA Counties
The distribution is based on data from 58 California counties.
CA Value
(93.8%)
The regional value is compared to the California state value.
Prior Value
(90.6%)
Prior Value compares a measured value with the previously measured value. Confidence intervals were taken into account in determining the direction of the comparison.
Trend
This comparison measures the indicator’s values over multiple time periods.<br>The Mann-Kendall Test for Statistical Significance is used to evaluate the trend<br>over 4 to 10 periods of measure, subject to data availability and comparability.
Babies with Low Birthweight County: Kings
Babies with Low Birthweight County: Kings
6.6%
(2019-2021)
Compared to:

CA Counties
The distribution is based on data from 56 California counties.
CA Value
(7.1%)
The regional value is compared to the California state value.
US Value
(8.5% in 2021)
The regional value is compared to the national value. The source for the national value is Centers for Disease Control and Prevention
Prior Value
(6.4%)
Prior Value compares a measured value with the previously measured value. Confidence intervals were taken into account in determining the direction of the comparison.
Trend
This comparison measures the indicator’s values over multiple time periods.<br>The Mann-Kendall Test for Statistical Significance is used to evaluate the trend<br>over 4 to 10 periods of measure, subject to data availability and comparability.
Congenital Syphilis Incidence Rate County: Kings
Congenital Syphilis Incidence Rate County: Kings
268.5
Cases per 100,000 live births
(2020)
Compared to:


CA Counties
The distribution is based on data from 58 California counties.
CA Value
(114.9)
The regional value is compared to the California state value.
Prior Value
(95.2)
Prior Value compares a measured value with the previously measured value. Confidence intervals were not taken into account in determining the direction of the comparison.
Trend
This comparison measures the indicator’s values over multiple time periods.<br>The Mann-Kendall Test for Statistical Significance is used to evaluate the trend<br>over 4 to 10 periods of measure, subject to data availability and comparability.
HP 2030 Target
(33.9)
In-Hospital Exclusive Breastfeeding County: Kings
In-Hospital Exclusive Breastfeeding County: Kings
60.7%
(2022)
Compared to:

CA Counties
The distribution is based on data from 58 California counties.
CA Value
(68.5%)
The regional value is compared to the California state value.
Prior Value
(57.0%)
Prior Value compares a measured value with the previously measured value. Confidence intervals were taken into account in determining the direction of the comparison.
Trend
This comparison measures the indicator’s values over multiple time periods.<br>The Mann-Kendall Test for Statistical Significance is used to evaluate the trend<br>over 4 to 10 periods of measure, subject to data availability and comparability.
Infant Mortality Rate County: Kings
Infant Mortality Rate County: Kings
4.1
Deaths per 1,000 live births
(2017-2019)
Compared to:
CA Value
(3.9)
The regional value is compared to the California state value.
US Value
(5.7)
The regional value is compared to the national value. The source for the national value is Centers for Disease Control and Prevention
Prior Value
(4.2)
Prior Value compares a measured value with the previously measured value. Confidence intervals were taken into account in determining the direction of the comparison.
Trend
This comparison measures the indicator’s values over multiple time periods.<br>The Mann-Kendall Test for Statistical Significance is used to evaluate the trend<br>over 4 to 10 periods of measure, subject to data availability and comparability.
HP 2030 Target
(5.0)
<div>MICH-02: Reduce the rate of infant deaths <strong>(LEADING HEALTH INDICATOR)</strong></div>
Infant Mortality Rate Zip Code: 93202
Infant Mortality Rate Zip Code: 93202
0.0*
Deaths per 1,000 live births
(2012)
Compared to:
Kings, CA County Value
(4.2)
The regional value is compared to the Kings County value.
Prior Value
(14.7)
Prior Value compares a measured value with the previously measured value. Confidence intervals were not taken into account in determining the direction of the comparison.
HP 2030 Target
(5.0)
<div>MICH-02: Reduce the rate of infant deaths <strong>(LEADING HEALTH INDICATOR)</strong></div>
Infant Mortality Rate Zip Code: 93204
Infant Mortality Rate Zip Code: 93204
0.0*
Deaths per 1,000 live births
(2012)
Compared to:
Kings, CA County Value
(4.2)
The regional value is compared to the Kings County value.
Prior Value
(0.0)
Prior Value compares a measured value with the previously measured value. Confidence intervals were not taken into account in determining the direction of the comparison.
HP 2030 Target
(5.0)
<div>MICH-02: Reduce the rate of infant deaths <strong>(LEADING HEALTH INDICATOR)</strong></div>
Infant Mortality Rate Zip Code: 93212
Infant Mortality Rate Zip Code: 93212
6.6*
Deaths per 1,000 live births
(2011)
Compared to:
Kings, CA County Value
(6.2)
The regional value is compared to the Kings County value.
Prior Value
(7.5)
Prior Value compares a measured value with the previously measured value. Confidence intervals were not taken into account in determining the direction of the comparison.
HP 2030 Target
(5.0)
<div>MICH-02: Reduce the rate of infant deaths <strong>(LEADING HEALTH INDICATOR)</strong></div>
Infant Mortality Rate Zip Code: 93230
Infant Mortality Rate Zip Code: 93230
3.0*
Deaths per 1,000 live births
(2012)
Compared to:
Kings, CA County Value
(4.2)
The regional value is compared to the Kings County value.
HP 2030 Target
(5.0)
<div>MICH-02: Reduce the rate of infant deaths <strong>(LEADING HEALTH INDICATOR)</strong></div>
Infant Mortality Rate Zip Code: 93239
Infant Mortality Rate Zip Code: 93239
0.0*
Deaths per 1,000 live births
(2012)
Compared to:
Kings, CA County Value
(4.2)
The regional value is compared to the Kings County value.
Prior Value
(0.0)
Prior Value compares a measured value with the previously measured value. Confidence intervals were not taken into account in determining the direction of the comparison.
HP 2030 Target
(5.0)
<div>MICH-02: Reduce the rate of infant deaths <strong>(LEADING HEALTH INDICATOR)</strong></div>
Infant Mortality Rate Zip Code: 93245
Infant Mortality Rate Zip Code: 93245
2.7*
Deaths per 1,000 live births
(2012)
Compared to:
Kings, CA County Value
(4.2)
The regional value is compared to the Kings County value.
Prior Value
(4.9)
Prior Value compares a measured value with the previously measured value. Confidence intervals were not taken into account in determining the direction of the comparison.
HP 2030 Target
(5.0)
<div>MICH-02: Reduce the rate of infant deaths <strong>(LEADING HEALTH INDICATOR)</strong></div>
Infant Mortality Rate Zip Code: 93266
Infant Mortality Rate Zip Code: 93266
0.0*
Deaths per 1,000 live births
(2012)
Compared to:
Kings, CA County Value
(4.2)
The regional value is compared to the Kings County value.
Prior Value
(0.0)
Prior Value compares a measured value with the previously measured value. Confidence intervals were not taken into account in determining the direction of the comparison.
HP 2030 Target
(5.0)
<div>MICH-02: Reduce the rate of infant deaths <strong>(LEADING HEALTH INDICATOR)</strong></div>
Mothers who Breastfeed County: Kings
Mothers who Breastfeed County: Kings
89.1%
(2018-2020)
Compared to:
CA Counties
The distribution is based on data from 58 California counties.
CA Value
(93.8%)
The regional value is compared to the California state value.
Prior Value
(89.8%)
Prior Value compares a measured value with the previously measured value. Confidence intervals were taken into account in determining the direction of the comparison.
Trend
This comparison measures the indicator’s values over multiple time periods.<br>The Mann-Kendall Test for Statistical Significance is used to evaluate the trend<br>over 4 to 10 periods of measure, subject to data availability and comparability.
Health / Maternal, Fetal & Infant Health
Mothers who Received Early Prenatal Care
Value
Compared to:
Mothers who Received Early Prenatal Care County: Kings
Mothers who Received Early Prenatal Care County: Kings
88.3%
(2019-2021)
Compared to:
CA Counties
The distribution is based on data from 58 California counties.
CA Value
(87.9%)
The regional value is compared to the California state value.
US Value
(78.3% in 2021)
The regional value is compared to the national value. The source for the national value is Centers for Disease Control and Prevention
Prior Value
(84.1%)
Prior Value compares a measured value with the previously measured value. Confidence intervals were taken into account in determining the direction of the comparison.
Trend
This comparison measures the indicator’s values over multiple time periods.<br>The Mann-Kendall Test for Statistical Significance is used to evaluate the trend<br>over 4 to 10 periods of measure, subject to data availability and comparability.
Preterm Births County: Kings
Preterm Births County: Kings
9.5%
(2020-2022)
Compared to:

CA Counties
The distribution is based on data from 58 California counties.
CA Value
(9.0%)
The regional value is compared to the California state value.
Prior Value
(9.3%)
Prior Value compares a measured value with the previously measured value. Confidence intervals were taken into account in determining the direction of the comparison.
Trend
This comparison measures the indicator’s values over multiple time periods.<br>The Mann-Kendall Test for Statistical Significance is used to evaluate the trend<br>over 4 to 10 periods of measure, subject to data availability and comparability.
HP 2030 Target
(9.4%)
Health / Maternal, Fetal & Infant Health
Respondents who are Aware of Free to Low-Cost Family Planning Services in the Community
Value
Compared to:
Respondents who are Aware of Free to Low-Cost Family Planning Services in the Community County: Kings
Respondents who are Aware of Free to Low-Cost Family Planning Services in the Community County: Kings
58.2%
(2023)
Compared to:
Prior Value
(44.2%)
Prior Value compares a measured value with the previously measured value. Confidence intervals were not taken into account in determining the direction of the comparison.
Kings County 2023 Target
(55.2%)
Teen Birth Rate: 15-19 County: Kings
Teen Birth Rate: 15-19 County: Kings
18.8
Live births per 1,000 females aged 15-19
(2019-2021)
Compared to:
CA Counties
The distribution is based on data from 55 California counties.
CA Value
(10.3)
The regional value is compared to the California state value.
US Value
(15.2)
The regional value is compared to the national value. The source for the national value is Centers for Disease Control and Prevention, National Center for Health Statistics
Prior Value
(20.4)
Prior Value compares a measured value with the previously measured value. Confidence intervals were taken into account in determining the direction of the comparison.
Trend
This comparison measures the indicator’s values over multiple time periods.<br>The Mann-Kendall Test for Statistical Significance is used to evaluate the trend<br>over 4 to 10 periods of measure, subject to data availability and comparability.
