
Search for Indicators
Substance Use
Indicator Gauge Icon Legend
Legend Colors
Red is bad, green is good, blue is not statistically different/neutral.
Compared to Distribution
 the value is in the best half of communities.
 the value is in the 2nd worst quarter of communities.
 the value is in the worst quarter of communities.
Compared to Target
 meets target;
  does not meet target.
Compared to a Single Value
 lower than the comparison value;
 higher than the comparison value;
 not statistically different from comparison value.
Trend

 non-significant change over time;
 significant change over time;
  no change over time.
Compared to Prior Value
 higher than the previous measurement period;
 lower than the previous measurement period;
 no statistically different change from previous measurement period.
Health / Alcohol & Drug Use
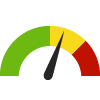
Adults who Binge Drink County: Kings
Adults who Binge Drink County: Kings
16.9%
(2021)
Compared to:


CA Counties
The distribution is based on data from 58 California counties.
U.S. Counties
The distribution is based on data from 3,074 U.S. counties and county equivalents.
US Value
(15.5%)
The regional value is compared to the national value.
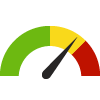
Age-Adjusted Annual Opioid Prescription Rate County: Kings
Age-Adjusted Annual Opioid Prescription Rate County: Kings
407.8
Prescriptions per 1,000 residents
(2022)
Compared to:
CA Counties
The distribution is based on data from 58 California counties.
CA Value
(291.0)
The regional value is compared to the California state value.
Prior Value
(425.4)
Prior Value compares a measured value with the previously measured value. Confidence intervals were taken into account in determining the direction of the comparison.
Trend
This comparison measures the indicator’s values over multiple time periods.<br>The Mann-Kendall Test for Statistical Significance is used to evaluate the trend<br>over 4 to 10 periods of measure, subject to data availability and comparability.
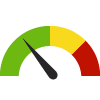
Age-Adjusted Buprenorphine Prescription Rate County: Kings
Age-Adjusted Buprenorphine Prescription Rate County: Kings
23.0
Prescriptions per 1,000 residents
(2022)
Compared to:


CA Value
(19.8)
The regional value is compared to the California state value.
Prior Value
(17.7)
Prior Value compares a measured value with the previously measured value. Confidence intervals were taken into account in determining the direction of the comparison.
Trend
This comparison measures the indicator’s values over multiple time periods.<br>The Mann-Kendall Test for Statistical Significance is used to evaluate the trend<br>over 4 to 10 periods of measure, subject to data availability and comparability.
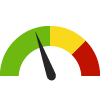
Age-Adjusted Death Rate due to All Opioid Overdose County: Kings
Age-Adjusted Death Rate due to All Opioid Overdose County: Kings
11.3
Rate per 100,000 residents
(2022)
Compared to:


CA Counties
The distribution is based on data from 58 California counties.
CA Value
(18.7)
The regional value is compared to the California state value.
Prior Value
(10.0)
Prior Value compares a measured value with the previously measured value. Confidence intervals were not taken into account in determining the direction of the comparison.
Trend
This comparison measures the indicator’s values over multiple time periods.<br>The Mann-Kendall Test for Statistical Significance is used to evaluate the trend<br>over 4 to 10 periods of measure, subject to data availability and comparability.
Age-Adjusted Death Rate due to Drug Use County: Kings
Age-Adjusted Death Rate due to Drug Use County: Kings
18.4
Deaths per 100,000 population
(2019-2021)
Compared to:

CA Counties
The distribution is based on data from 57 California counties.
CA Value
(21.4)
The regional value is compared to the California state value.
Prior Value
(18.3)
Prior Value compares a measured value with the previously measured value. Confidence intervals were taken into account in determining the direction of the comparison.
Trend
This comparison measures the indicator’s values over multiple time periods.<br>The Mann-Kendall Test for Statistical Significance is used to evaluate the trend<br>over 4 to 10 periods of measure, subject to data availability and comparability.
Age-Adjusted Death Rate due to Fentanyl Overdose County: Kings
Age-Adjusted Death Rate due to Fentanyl Overdose County: Kings
9.3
(2022)
Compared to:
CA Counties
The distribution is based on data from 58 California counties.
CA Value
(16.6)
The regional value is compared to the California state value.
Prior Value
(6.0)
Prior Value compares a measured value with the previously measured value. Confidence intervals were not taken into account in determining the direction of the comparison.
Trend
This comparison measures the indicator’s values over multiple time periods.<br>The Mann-Kendall Test for Statistical Significance is used to evaluate the trend<br>over 4 to 10 periods of measure, subject to data availability and comparability.
Age-Adjusted Death Rate due to Heroin Overdose County: Kings
Age-Adjusted Death Rate due to Heroin Overdose County: Kings
0.0*
Deaths per 100,000 population
(2022)
Compared to:
CA Counties
(2018)
The distribution is based on data from 58 California counties.
CA Value
(1.2)
The regional value is compared to the California state value.
Prior Value
(0.0)
Prior Value compares a measured value with the previously measured value. Confidence intervals were not taken into account in determining the direction of the comparison.
Trend
This comparison measures the indicator’s values over multiple time periods.<br>The Mann-Kendall Test for Statistical Significance is used to evaluate the trend<br>over 4 to 10 periods of measure, subject to data availability and comparability.
HP 2030 Target
(4.2)
Health / Alcohol & Drug Use
Age-Adjusted Death Rate due to Prescription Opioid Overdose
Value
Compared to:
Age-Adjusted Death Rate due to Prescription Opioid Overdose County: Kings
Age-Adjusted Death Rate due to Prescription Opioid Overdose County: Kings
11.3
Rate per 100,000 residents
(2022)
Compared to:
CA Counties
The distribution is based on data from 58 California counties.
CA Value
(18.1)
The regional value is compared to the California state value.
Prior Value
(9.4)
Prior Value compares a measured value with the previously measured value. Confidence intervals were not taken into account in determining the direction of the comparison.
Trend
This comparison measures the indicator’s values over multiple time periods.<br>The Mann-Kendall Test for Statistical Significance is used to evaluate the trend<br>over 4 to 10 periods of measure, subject to data availability and comparability.
Health / Alcohol & Drug Use
Age-Adjusted Death Rate due to Synthetic Opioid Overdose (excluding Methadone)
Value
Compared to:
Age-Adjusted Death Rate due to Synthetic Opioid Overdose (excluding Methadone) County: Kings
Age-Adjusted Death Rate due to Synthetic Opioid Overdose (excluding Methadone) County: Kings
9.8
Rate per 100,000 residents
(2022)
Compared to:
CA Counties
The distribution is based on data from 58 California counties.
CA Value
(16.7)
The regional value is compared to the California state value.
Prior Value
(6.6)
Prior Value compares a measured value with the previously measured value. Confidence intervals were not taken into account in determining the direction of the comparison.
Trend
This comparison measures the indicator’s values over multiple time periods.<br>The Mann-Kendall Test for Statistical Significance is used to evaluate the trend<br>over 4 to 10 periods of measure, subject to data availability and comparability.
HP 2030 Target
(8.9)
<div>IVP-22: Reduce overdose deaths involving synthetic opioids other than methadone</div>
Health / Alcohol & Drug Use
Age-Adjusted Drug and Opioid-Involved Overdose Death Rate
Value
Compared to:
Age-Adjusted Drug and Opioid-Involved Overdose Death Rate County: Kings
Age-Adjusted Drug and Opioid-Involved Overdose Death Rate County: Kings
15.3
Deaths per 100,000 population
(2018-2020)
Compared to:
CA Counties
The distribution is based on data from 48 California counties.
U.S. Counties
The distribution is based on data from 1,303 U.S. counties and county equivalents.
CA Value
(16.5)
The regional value is compared to the California state value.
US Value
(23.5)
The regional value is compared to the national value.
Prior Value
(15.2)
Prior Value compares a measured value with the previously measured value. Confidence intervals were taken into account in determining the direction of the comparison.
Age-Adjusted ED Visit Rate due to All Drug Overdose County: Kings
Age-Adjusted ED Visit Rate due to All Drug Overdose County: Kings
157.5
Rate per 100,000 residents
(2022)
Compared to:
CA Counties
The distribution is based on data from 58 California counties.
CA Value
(143.7)
The regional value is compared to the California state value.
Prior Value
(152.6)
Prior Value compares a measured value with the previously measured value. Confidence intervals were not taken into account in determining the direction of the comparison.
Trend
This comparison measures the indicator’s values over multiple time periods.<br>The Mann-Kendall Test for Statistical Significance is used to evaluate the trend<br>over 4 to 10 periods of measure, subject to data availability and comparability.
Age-Adjusted ED Visit Rate due to Heroin Overdose County: Kings
Age-Adjusted ED Visit Rate due to Heroin Overdose County: Kings
13.9
Rate per 100,000 residents
(2022)
Compared to:
CA Counties
The distribution is based on data from 58 California counties.
CA Value
(3.6)
The regional value is compared to the California state value.
Prior Value
(6.8)
Prior Value compares a measured value with the previously measured value. Confidence intervals were not taken into account in determining the direction of the comparison.
Trend
This comparison measures the indicator’s values over multiple time periods.<br>The Mann-Kendall Test for Statistical Significance is used to evaluate the trend<br>over 4 to 10 periods of measure, subject to data availability and comparability.
Health / Alcohol & Drug Use
Age-Adjusted ED Visit Rate due to Opioid Overdose (excluding Heroin)
Value
Compared to:
Age-Adjusted ED Visit Rate due to Opioid Overdose (excluding Heroin) County: Kings
Age-Adjusted ED Visit Rate due to Opioid Overdose (excluding Heroin) County: Kings
51.5
Rate per 100,000 residents
(2022)
Compared to:
CA Counties
The distribution is based on data from 58 California counties.
CA Value
(54.9)
The regional value is compared to the California state value.
Prior Value
(9.0)
Prior Value compares a measured value with the previously measured value. Confidence intervals were not taken into account in determining the direction of the comparison.
Trend
This comparison measures the indicator’s values over multiple time periods.<br>The Mann-Kendall Test for Statistical Significance is used to evaluate the trend<br>over 4 to 10 periods of measure, subject to data availability and comparability.
Health / Alcohol & Drug Use
Age-Adjusted Hospitalization Rate due to All Drug Overdose
Value
Compared to:
Age-Adjusted Hospitalization Rate due to All Drug Overdose County: Kings
Age-Adjusted Hospitalization Rate due to All Drug Overdose County: Kings
44.0
Rate per 100,000 residents
(2022)
Compared to:
CA Counties
The distribution is based on data from 58 California counties.
CA Value
(48.3)
The regional value is compared to the California state value.
Prior Value
(53.4)
Prior Value compares a measured value with the previously measured value. Confidence intervals were not taken into account in determining the direction of the comparison.
Trend
This comparison measures the indicator’s values over multiple time periods.<br>The Mann-Kendall Test for Statistical Significance is used to evaluate the trend<br>over 4 to 10 periods of measure, subject to data availability and comparability.
Health / Alcohol & Drug Use
Age-Adjusted Hospitalization Rate due to Heroin Overdose
Value
Compared to:
Age-Adjusted Hospitalization Rate due to Heroin Overdose County: Kings
Age-Adjusted Hospitalization Rate due to Heroin Overdose County: Kings
0.5
Rate per 100,000 residents
(2022)
Compared to:
CA Counties
The distribution is based on data from 58 California counties.
CA Value
(0.7)
The regional value is compared to the California state value.
Prior Value
(1.2)
Prior Value compares a measured value with the previously measured value. Confidence intervals were not taken into account in determining the direction of the comparison.
Trend
This comparison measures the indicator’s values over multiple time periods.<br>The Mann-Kendall Test for Statistical Significance is used to evaluate the trend<br>over 4 to 10 periods of measure, subject to data availability and comparability.
Health / Alcohol & Drug Use
Age-Adjusted Hospitalization Rate due to Opioid Overdose (excluding Heroin)
Value
Compared to:
Age-Adjusted Hospitalization Rate due to Opioid Overdose (excluding Heroin) County: Kings
Age-Adjusted Hospitalization Rate due to Opioid Overdose (excluding Heroin) County: Kings
8.7
Rate per 100,000 residents
(2022)
Compared to:
CA Counties
The distribution is based on data from 58 California counties.
CA Value
(12.1)
The regional value is compared to the California state value.
Prior Value
(9.0)
Prior Value compares a measured value with the previously measured value. Confidence intervals were not taken into account in determining the direction of the comparison.
Trend
This comparison measures the indicator’s values over multiple time periods.<br>The Mann-Kendall Test for Statistical Significance is used to evaluate the trend<br>over 4 to 10 periods of measure, subject to data availability and comparability.
Health / Alcohol & Drug Use
Age-Adjusted Long Acting or Extended Release Opioid Prescription Rate to Opioid Naive Residents
Value
Compared to:
Age-Adjusted Long Acting or Extended Release Opioid Prescription Rate to Opioid Naive Residents County: Kings
Age-Adjusted Long Acting or Extended Release Opioid Prescription Rate to Opioid Naive Residents County: Kings
1.7
Per 100,000 population
(2022)
Compared to:
CA Counties
The distribution is based on data from 58 California counties.
CA Value
(1.2)
The regional value is compared to the California state value.
Prior Value
(1.8)
Prior Value compares a measured value with the previously measured value. Confidence intervals were taken into account in determining the direction of the comparison.
Trend
This comparison measures the indicator’s values over multiple time periods.<br>The Mann-Kendall Test for Statistical Significance is used to evaluate the trend<br>over 4 to 10 periods of measure, subject to data availability and comparability.
Alcohol-Impaired Driving Deaths County: Kings
Alcohol-Impaired Driving Deaths County: Kings
36.5%
Percent of driving deaths with alcohol involvement
(2017-2021)
Compared to:

CA Counties
The distribution is based on data from 58 California counties.
U.S. Counties
The distribution is based on data from 3,116 U.S. counties and county equivalents.
CA Value
(26.7%)
The regional value is compared to the California state value.
US Value
(26.3%)
The regional value is compared to the national value.
Prior Value
(35.0%)
Prior Value compares a measured value with the previously measured value. Confidence intervals were taken into account in determining the direction of the comparison.
Trend
This comparison measures the indicator’s values over multiple time periods.<br>The Mann-Kendall Test for Statistical Significance is used to evaluate the trend<br>over 4 to 10 periods of measure, subject to data availability and comparability.
Death Rate due to Drug Poisoning County: Kings
Death Rate due to Drug Poisoning County: Kings
16.6
Deaths per 100,000 population
(2019-2021)
Compared to:
CA Counties
The distribution is based on data from 54 California counties.
U.S. Counties
The distribution is based on data from 1,899 U.S. counties and county equivalents.
CA Value
(22.0)
The regional value is compared to the California state value.
US Value
(27.2)
The regional value is compared to the national value.
HP 2030 Target
(20.7)
<div>SU-03: Reduce drug overdose deaths <strong>(LEADING HEALTH INDICATOR)</strong></div>
Health / Alcohol & Drug Use
Households that Received Substance Abuse Medical Services
Value
Compared to:
Households that Received Substance Abuse Medical Services County: Kings
Households that Received Substance Abuse Medical Services County: Kings
1.7%
(2023)
Compared to:

CA Value
(1.3%)
The regional value is compared to the California state value.
US Value
(1.3%)
The regional value is compared to the national value.
Prior Value
(1.5%)
Prior Value compares a measured value with the previously measured value. Confidence intervals were not taken into account in determining the direction of the comparison.
Trend
This comparison measures the indicator’s values over multiple time periods.<br>The Mann-Kendall Test for Statistical Significance is used to evaluate the trend<br>over 4 to 10 periods of measure, subject to data availability and comparability.
Liquor Store Density County: Kings
Liquor Store Density County: Kings
3.3
Stores per 100,000 population
(2021)
Compared to:

CA Counties
The distribution is based on data from 44 California counties.
U.S. Counties
The distribution is based on data from 1,477 U.S. counties and county equivalents.
CA Value
(11.0)
The regional value is compared to the California state value.
US Value
(10.7)
The regional value is compared to the national value.
Prior Value
(3.3)
Prior Value compares a measured value with the previously measured value. Confidence intervals were not taken into account in determining the direction of the comparison.
Trend
This comparison measures the indicator’s values over multiple time periods.<br>The Mann-Kendall Test for Statistical Significance is used to evaluate the trend<br>over 4 to 10 periods of measure, subject to data availability and comparability.
Health / Alcohol & Drug Use
Number of Champions clients who completed Amanda's House services
Value
Compared to:
Number of Champions clients who completed Amanda's House services County: Kings
Number of Champions clients who completed Amanda's House services County: Kings
3
People
(2021)
Compared to:

Prior Value
(10)
Prior Value compares a measured value with the previously measured value. Confidence intervals were not taken into account in determining the direction of the comparison.
Health / Alcohol & Drug Use
Number of Champions clients who completed Frasiuer's Home services
Value
Compared to:
Number of Champions clients who completed Frasiuer's Home services County: Kings
Number of Champions clients who completed Frasiuer's Home services County: Kings
6
People
(2021)
Compared to:
Prior Value
(6)
Prior Value compares a measured value with the previously measured value. Confidence intervals were not taken into account in determining the direction of the comparison.
Health / Alcohol & Drug Use
Number of Champions clients who completed Grace Home services
Value
Compared to:
Number of Champions clients who completed Grace Home services County: Kings
Number of Champions clients who completed Grace Home services County: Kings
13
People
(2021)
Compared to:
Prior Value
(16)
Prior Value compares a measured value with the previously measured value. Confidence intervals were not taken into account in determining the direction of the comparison.
Health / Alcohol & Drug Use
Number of Champions clients who completed Hannah's House services
Value
Compared to:
Number of Champions clients who completed Hannah's House services County: Kings
Number of Champions clients who completed Hannah's House services County: Kings
10
People
(2021)
Compared to:
Prior Value
(20)
Prior Value compares a measured value with the previously measured value. Confidence intervals were not taken into account in determining the direction of the comparison.
Health / Alcohol & Drug Use
Number of Champions clients who completed Samuel's House services
Value
Compared to:
Number of Champions clients who completed Samuel's House services County: Kings
Number of Champions clients who completed Samuel's House services County: Kings
44
People
(2021)
Compared to:
Prior Value
(33)
Prior Value compares a measured value with the previously measured value. Confidence intervals were not taken into account in determining the direction of the comparison.
Health / Alcohol & Drug Use
Number of Champions clients who use Amanda's House services
Value
Compared to:
Number of Champions clients who use Amanda's House services County: Kings
Number of Champions clients who use Amanda's House services County: Kings
7
People
(2021)
Compared to:
Prior Value
(14)
Prior Value compares a measured value with the previously measured value. Confidence intervals were not taken into account in determining the direction of the comparison.
Health / Alcohol & Drug Use
Number of Champions clients who use Frasieur's Home services
Value
Compared to:
Number of Champions clients who use Frasieur's Home services County: Kings
Number of Champions clients who use Frasieur's Home services County: Kings
14
People
(2021)
Compared to:
Prior Value
(9)
Prior Value compares a measured value with the previously measured value. Confidence intervals were not taken into account in determining the direction of the comparison.
Health / Alcohol & Drug Use
Number of Champions clients who use Grace Home services
Value
Compared to:
Number of Champions clients who use Grace Home services County: Kings
Number of Champions clients who use Grace Home services County: Kings
15
People
(2021)
Compared to:
Prior Value
(19)
Prior Value compares a measured value with the previously measured value. Confidence intervals were not taken into account in determining the direction of the comparison.
Health / Alcohol & Drug Use
Number of Champions clients who use Hannah's House services
Value
Compared to:
Number of Champions clients who use Hannah's House services County: Kings
Number of Champions clients who use Hannah's House services County: Kings
41
People enrolled
(2021)
Compared to:
Prior Value
(41)
Prior Value compares a measured value with the previously measured value. Confidence intervals were not taken into account in determining the direction of the comparison.
Health / Alcohol & Drug Use
Number of Champions clients who use Intensive Outpatient Treatment (IOT) services
Value
Compared to:
Number of Champions clients who use Intensive Outpatient Treatment (IOT) services County: Kings
Number of Champions clients who use Intensive Outpatient Treatment (IOT) services County: Kings
0
People
(2021-2022)
Compared to:
Prior Value
Prior Value compares a measured value with the previously measured value. Confidence intervals were not taken into account in determining the direction of the comparison.
Health / Alcohol & Drug Use
Number of Champions clients who use Outpatient Drug Free (ODF) services
Value
Compared to:
Number of Champions clients who use Outpatient Drug Free (ODF) services County: Kings
Number of Champions clients who use Outpatient Drug Free (ODF) services County: Kings
156
People
(2021-2022)
Compared to:
Prior Value
(147)
Prior Value compares a measured value with the previously measured value. Confidence intervals were not taken into account in determining the direction of the comparison.
Number of Champions clients who use PE services County: Kings
Number of Champions clients who use PE services County: Kings
219
People
(2021-2022)
Compared to:
Prior Value
(210)
Prior Value compares a measured value with the previously measured value. Confidence intervals were not taken into account in determining the direction of the comparison.
Health / Alcohol & Drug Use
Number of Champions clients who use Samuel's House services
Value
Compared to:
Number of Champions clients who use Samuel's House services County: Kings
Number of Champions clients who use Samuel's House services County: Kings
153
People
(2021)
Compared to:
Prior Value
(94)
Prior Value compares a measured value with the previously measured value. Confidence intervals were not taken into account in determining the direction of the comparison.
Opioid Prescription Patients County: Kings
Opioid Prescription Patients County: Kings
2.6%
(Q3 2022)
Compared to:
CA Counties
The distribution is based on data from 58 California counties.
Prior Value
(2.6%)
Prior Value compares a measured value with the previously measured value. Confidence intervals were not taken into account in determining the direction of the comparison.
Trend
This comparison measures the indicator’s values over multiple time periods.<br>The Mann-Kendall Test for Statistical Significance is used to evaluate the trend<br>over 4 to 10 periods of measure, subject to data availability and comparability.
Quarterly Opioid Prescription Rate County: Kings
Quarterly Opioid Prescription Rate County: Kings
300.8
Prescriptions per 10,000 population
(Q3 2022)
Compared to:
CA Counties
The distribution is based on data from 58 California counties.
Prior Value
(293.0)
Prior Value compares a measured value with the previously measured value. Confidence intervals were not taken into account in determining the direction of the comparison.
Trend
This comparison measures the indicator’s values over multiple time periods.<br>The Mann-Kendall Test for Statistical Significance is used to evaluate the trend<br>over 4 to 10 periods of measure, subject to data availability and comparability.
Health / Alcohol & Drug Use
Residents on More than 90 Morphine Milligram Equivalents (MME) of Opioids Daily
Value
Compared to:
Residents on More than 90 Morphine Milligram Equivalents (MME) of Opioids Daily County: Kings
Residents on More than 90 Morphine Milligram Equivalents (MME) of Opioids Daily County: Kings
6.6
Residents on >90 MMEs of Opioids per 1,000 residents
(2022)
Compared to:
CA Counties
The distribution is based on data from 58 California counties.
CA Value
(6.3)
The regional value is compared to the California state value.
Prior Value
(7.1)
Prior Value compares a measured value with the previously measured value. Confidence intervals were taken into account in determining the direction of the comparison.
Trend
This comparison measures the indicator’s values over multiple time periods.<br>The Mann-Kendall Test for Statistical Significance is used to evaluate the trend<br>over 4 to 10 periods of measure, subject to data availability and comparability.
Respondents who are aware of Champions resources County: Kings
Respondents who are aware of Champions resources County: Kings
25.9%
(2023)
Compared to:
Prior Value
(12.9%)
Prior Value compares a measured value with the previously measured value. Confidence intervals were not taken into account in determining the direction of the comparison.
Health / Alcohol & Drug Use
Respondents who Have Used Drug and Alcohol Services in the Community
Value
Compared to:
Respondents who Have Used Drug and Alcohol Services in the Community County: Kings
Respondents who Have Used Drug and Alcohol Services in the Community County: Kings
12.3%
(2023)
Compared to:
Prior Value
(3.4%)
Prior Value compares a measured value with the previously measured value. Confidence intervals were not taken into account in determining the direction of the comparison.
Trend
This comparison measures the indicator’s values over multiple time periods.<br>The Mann-Kendall Test for Statistical Significance is used to evaluate the trend<br>over 4 to 10 periods of measure, subject to data availability and comparability.
Teens who have Used Alcohol County: Kings
Teens who have Used Alcohol County: Kings
40.5%
(2021-2022)
Compared to:
CA Counties
(2011-2012)
The distribution is based on data from 44 California counties and county groups.
CA Value
(23.1% in 2019-2021)
The regional value is compared to the California state value.
Prior Value
(30.8%)
Prior Value compares a measured value with the previously measured value. Confidence intervals were taken into account in determining the direction of the comparison.
Trend
This comparison measures the indicator’s values over multiple time periods.<br>The Mann-Kendall Test for Statistical Significance is used to evaluate the trend<br>over 4 to 10 periods of measure, subject to data availability and comparability.
