
Search for Indicators
Violence & Public Safety
Indicator Gauge Icon Legend
Legend Colors
Red is bad, green is good, blue is not statistically different/neutral.
Compared to Distribution
 the value is in the best half of communities.
 the value is in the 2nd worst quarter of communities.
 the value is in the worst quarter of communities.
Compared to Target
 meets target;
  does not meet target.
Compared to a Single Value
 lower than the comparison value;
 higher than the comparison value;
 not statistically different from comparison value.
Trend

 non-significant change over time;
 significant change over time;
  no change over time.
Compared to Prior Value
 higher than the previous measurement period;
 lower than the previous measurement period;
 no statistically different change from previous measurement period.
Community / Crime & Crime Prevention
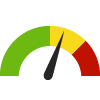
Adult Arrest Rate County: Kings
Adult Arrest Rate County: Kings
49.9
Arrests per 1,000 population 18+
(2022)
Compared to:


CA Counties
The distribution is based on data from 58 California counties.
CA Value
(25.1)
The regional value is compared to the California state value.
Prior Value
(62.9)
Prior Value compares a measured value with the previously measured value. Confidence intervals were not taken into account in determining the direction of the comparison.
Trend
This comparison measures the indicator’s values over multiple time periods.<br>The Mann-Kendall Test for Statistical Significance is used to evaluate the trend<br>over 4 to 10 periods of measure, subject to data availability and comparability.
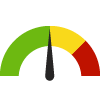
Age-Adjusted Death Rate due to Firearms County: Kings
Age-Adjusted Death Rate due to Firearms County: Kings
7.9
Deaths per 100,000 population
(2018-2020)
Compared to:

CA Counties
The distribution is based on data from 45 California counties.
U.S. Counties
The distribution is based on data from 1,083 U.S. counties and county equivalents.
CA Value
(7.4)
The regional value is compared to the California state value.
US Value
(12.0)
The regional value is compared to the national value.
Prior Value
(7.7)
Prior Value compares a measured value with the previously measured value. Confidence intervals were taken into account in determining the direction of the comparison.
Trend
This comparison measures the indicator’s values over multiple time periods.<br>The Mann-Kendall Test for Statistical Significance is used to evaluate the trend<br>over 4 to 10 periods of measure, subject to data availability and comparability.
HP 2030 Target
(10.7)
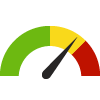
Age-Adjusted Death Rate due to Homicide County: Kings
Age-Adjusted Death Rate due to Homicide County: Kings
6.5
Deaths per 100,000 population
(2018-2020)
Compared to:
CA Counties
The distribution is based on data from 32 California counties.
U.S. Counties
The distribution is based on data from 495 U.S. counties and county equivalents.
CA Value
(5.1)
The regional value is compared to the California state value.
US Value
(6.6)
The regional value is compared to the national value.
Prior Value
(5.1)
Prior Value compares a measured value with the previously measured value. Confidence intervals were taken into account in determining the direction of the comparison.
Trend
This comparison measures the indicator’s values over multiple time periods.<br>The Mann-Kendall Test for Statistical Significance is used to evaluate the trend<br>over 4 to 10 periods of measure, subject to data availability and comparability.
HP 2030 Target
(5.5)
<div>IVP-09: Reduce homicides <strong>(LEADING HEALTH INDICATOR)</strong></div>
Deaths in Custody County: Kings
Deaths in Custody County: Kings
2.9
Per 10,000 population
(2022)
Compared to:


CA Value
(0.3)
The regional value is compared to the California state value.
Prior Value
(2.6)
Prior Value compares a measured value with the previously measured value. Confidence intervals were not taken into account in determining the direction of the comparison.
Trend
This comparison measures the indicator’s values over multiple time periods.<br>The Mann-Kendall Test for Statistical Significance is used to evaluate the trend<br>over 4 to 10 periods of measure, subject to data availability and comparability.
Hate Crime Offenses County: Kings
Hate Crime Offenses County: Kings
4*
Offenses
(2022)
Compared to:
Prior Value
(4)
Prior Value compares a measured value with the previously measured value. Confidence intervals were not taken into account in determining the direction of the comparison.
Trend
This comparison measures the indicator’s values over multiple time periods.<br>The Mann-Kendall Test for Statistical Significance is used to evaluate the trend<br>over 4 to 10 periods of measure, subject to data availability and comparability.
Juvenile Arrest Rate County: Kings
Juvenile Arrest Rate County: Kings
7.1
Arrests per 1,000 population aged 0-17
(2022)
Compared to:
CA Counties
The distribution is based on data from 57 California counties.
CA Value
(2.8)
The regional value is compared to the California state value.
Prior Value
(5.3)
Prior Value compares a measured value with the previously measured value. Confidence intervals were not taken into account in determining the direction of the comparison.
Trend
This comparison measures the indicator’s values over multiple time periods.<br>The Mann-Kendall Test for Statistical Significance is used to evaluate the trend<br>over 4 to 10 periods of measure, subject to data availability and comparability.
Community / Crime & Crime Prevention
Respondents who need assistance with working with law enforcement
Value
Compared to:
Respondents who need assistance with working with law enforcement County: Kings
Respondents who need assistance with working with law enforcement County: Kings
10.5%
(2023)
Compared to:
Prior Value
(2.0%)
Prior Value compares a measured value with the previously measured value. Confidence intervals were not taken into account in determining the direction of the comparison.
Violent Crime Rate County: Kings
Violent Crime Rate County: Kings
425.8
Crimes per 100,000 population
(2022)
Compared to:
CA Counties
The distribution is based on data from 58 California counties.
CA Value
(493.1)
The regional value is compared to the California state value.
US Value
(380.7)
The regional value is compared to the national value. The source for the national value is Federal Bureau of Investigation
Prior Value
(446.6)
Prior Value compares a measured value with the previously measured value. Confidence intervals were not taken into account in determining the direction of the comparison.
Trend
This comparison measures the indicator’s values over multiple time periods.<br>The Mann-Kendall Test for Statistical Significance is used to evaluate the trend<br>over 4 to 10 periods of measure, subject to data availability and comparability.
Community / Domestic Violence & Abuse
Community / Domestic Violence & Abuse
Respondents who Have Been Victims of Violence in their Homes
Value
Compared to:
Respondents who Have Been Victims of Violence in their Homes County: Kings
Respondents who Have Been Victims of Violence in their Homes County: Kings
34.7%
(2023)
Compared to:
Prior Value
(11.6%)
Prior Value compares a measured value with the previously measured value. Confidence intervals were not taken into account in determining the direction of the comparison.
Trend
This comparison measures the indicator’s values over multiple time periods.<br>The Mann-Kendall Test for Statistical Significance is used to evaluate the trend<br>over 4 to 10 periods of measure, subject to data availability and comparability.
Kings County 2023 Target
(11.7%)
Community / Domestic Violence & Abuse
Respondents who Have Used Victim Services in the Community
Value
Compared to:
Respondents who Have Used Victim Services in the Community County: Kings
Respondents who Have Used Victim Services in the Community County: Kings
18.2%
(2023)
Compared to:


Prior Value
(5.2%)
Prior Value compares a measured value with the previously measured value. Confidence intervals were not taken into account in determining the direction of the comparison.
Trend
This comparison measures the indicator’s values over multiple time periods.<br>The Mann-Kendall Test for Statistical Significance is used to evaluate the trend<br>over 4 to 10 periods of measure, subject to data availability and comparability.
Community / Domestic Violence & Abuse
Respondents Who Have Witnessed Violence In their Home
Value
Compared to:
Respondents Who Have Witnessed Violence In their Home County: Kings
Respondents Who Have Witnessed Violence In their Home County: Kings
37.4%
(2023)
Compared to:
Prior Value
(13.4%)
Prior Value compares a measured value with the previously measured value. Confidence intervals were not taken into account in determining the direction of the comparison.
Trend
This comparison measures the indicator’s values over multiple time periods.<br>The Mann-Kendall Test for Statistical Significance is used to evaluate the trend<br>over 4 to 10 periods of measure, subject to data availability and comparability.
Kings County 2023 Target
(11.5%)
Substantiated Child Abuse Rate County: Kings
Substantiated Child Abuse Rate County: Kings
6.1
Cases per 1,000 children
(2022)
Compared to:
CA Value
(6.1)
The regional value is compared to the California state value.
US Value
(8.2 in 2021)
The regional value is compared to the national value. The source for the national value is Children's Bureau
Prior Value
(4.7)
Prior Value compares a measured value with the previously measured value. Confidence intervals were not taken into account in determining the direction of the comparison.
Trend
This comparison measures the indicator’s values over multiple time periods.<br>The Mann-Kendall Test for Statistical Significance is used to evaluate the trend<br>over 4 to 10 periods of measure, subject to data availability and comparability.
HP 2030 Target
(8.7)
Community / Public Safety
Community / Public Safety
Age-Adjusted Death Rate due to Motor Vehicle Traffic Collisions
Value
Compared to:
Age-Adjusted Death Rate due to Motor Vehicle Traffic Collisions County: Kings
Age-Adjusted Death Rate due to Motor Vehicle Traffic Collisions County: Kings
14.6
Deaths per 100,000 population
(2019-2021)
Compared to:
CA Counties
The distribution is based on data from 57 California counties.
CA Value
(10.7)
The regional value is compared to the California state value.
US Value
(12.0 in 2020)
The regional value is compared to the national value. The source for the national value is Centers for Disease Control and Prevention
Prior Value
(15.4)
Prior Value compares a measured value with the previously measured value. Confidence intervals were taken into account in determining the direction of the comparison.
Trend
This comparison measures the indicator’s values over multiple time periods.<br>The Mann-Kendall Test for Statistical Significance is used to evaluate the trend<br>over 4 to 10 periods of measure, subject to data availability and comparability.
HP 2030 Target
(10.1)
Alcohol-Impaired Driving Deaths County: Kings
Alcohol-Impaired Driving Deaths County: Kings
36.5%
Percent of driving deaths with alcohol involvement
(2017-2021)
Compared to:


CA Counties
The distribution is based on data from 58 California counties.
U.S. Counties
The distribution is based on data from 3,116 U.S. counties and county equivalents.
CA Value
(26.7%)
The regional value is compared to the California state value.
US Value
(26.3%)
The regional value is compared to the national value.
Prior Value
(35.0%)
Prior Value compares a measured value with the previously measured value. Confidence intervals were taken into account in determining the direction of the comparison.
Trend
This comparison measures the indicator’s values over multiple time periods.<br>The Mann-Kendall Test for Statistical Significance is used to evaluate the trend<br>over 4 to 10 periods of measure, subject to data availability and comparability.
Bicycle-Involved Collision Rate County: Kings
Bicycle-Involved Collision Rate County: Kings
0.0
Collisions per 100,000 population
(2023)
Compared to:
CA Counties
(2022)
The distribution is based on data from 58 California counties.
CA Value
(0.3)
The regional value is compared to the California state value.
Prior Value
(11.2)
Prior Value compares a measured value with the previously measured value. Confidence intervals were not taken into account in determining the direction of the comparison.
Trend
This comparison measures the indicator’s values over multiple time periods.<br>The Mann-Kendall Test for Statistical Significance is used to evaluate the trend<br>over 4 to 10 periods of measure, subject to data availability and comparability.
Community / Public Safety
Respondents Who Have Been Victims of Violence Their Community
Value
Compared to:
Respondents Who Have Been Victims of Violence Their Community County: Kings
Respondents Who Have Been Victims of Violence Their Community County: Kings
41.1%
(2023)
Compared to:
Prior Value
(13.3%)
Prior Value compares a measured value with the previously measured value. Confidence intervals were not taken into account in determining the direction of the comparison.
Trend
This comparison measures the indicator’s values over multiple time periods.<br>The Mann-Kendall Test for Statistical Significance is used to evaluate the trend<br>over 4 to 10 periods of measure, subject to data availability and comparability.
Kings County 2023 Target
(14.9%)
Community / Public Safety
Respondents who Have Witnessed Violence their Community
Value
Compared to:
Respondents who Have Witnessed Violence their Community County: Kings
Respondents who Have Witnessed Violence their Community County: Kings
62.4%
(2023)
Compared to:
Prior Value
(40.4%)
Prior Value compares a measured value with the previously measured value. Confidence intervals were not taken into account in determining the direction of the comparison.
Trend
This comparison measures the indicator’s values over multiple time periods.<br>The Mann-Kendall Test for Statistical Significance is used to evaluate the trend<br>over 4 to 10 periods of measure, subject to data availability and comparability.
Kings County 2023 Target
(32.2%)
